Docker Reference_Links-https://www.tutorialspoint.com/docker/docker_tutorial.pdf
https://docs.docker.com/get-started/#setup
https://docs.docker.com/
For Docker network-https://docs.docker.com/engine/userguide/networking/work-with-networks/
https://docs.docker.com/engine/swarm/networking/
https://docs.docker.com/engine/userguide/networking/default_network/container-communication/
https://docs.docker.com/engine/api/v1.25/#section/Versioning
—————————————————————————————————————————————–
——–Why DevOps—–
- Increase the speed, efficiency and quality of software delivery as well as improving staff morale and motivation.
- Shorter Development Cycles, Faster Innovation
- Removes silos (the communication barriers between teams)
4. As the burden of manual work is removed from staff members, they can then focus on more creative work that increases their job satisfaction
5. Reduced Deployment Failures, Rollbacks, and Time to Recover
6. Improved Communication and Collaboration
7. Increased Efficiency
8. Reduced Costs and IT Headcount
9. Faster application delivery, enhanced innovation, more stable operating environments, performance-focused employee teams.
10. less complexity
11. Faster resolution of problems.
12. More stable operating environments.
13. More time to innovate (rather than fix/maintain)
14. 200 times more frequent deploys, 24 times faster recovery time, 3 times lower change failure rates, 50% less time on solving security issue, 22 % less time on unplanned work and rework.
15. Responsible for delivering both new features and stability.
16. Quicker mitigation of software defects
17. Reduced human errors
18. Enhanced version control
What is Docker?
Docker is a tool designed to make it easier to create, deploy, and run applications by using containers. Containers allow a developer to package up an application with all of the parts it needs, such as libraries and other dependencies, and ship it all out as one package.
Why Do I need to use Docker?
Ans: Docker provides this same capability without the overhead of a virtual machine. It lets you put your environment and configuration into code and deploy it.
The same Docker configuration can also be used in a variety of environments. This decouples (Seperates)infrastructure requirements from the application environment.
When To Use Docker?
(Reference Link :-https://www.ctl.io/developers/blog/post/what-is-docker-and-when-to-use-it/)
- Use Docker as version control system for your entire app’s operating system
- Use Docker when you want to distribute/collaborate on your app’s operating system with a team
- Use Docker to run your code on your laptop in the same environment as you have on your server (try the building tool)
- Use Docker whenever your app needs to go through multiple phases of development (dev/test/qa/prod, try Droneor Shippable, both do Docker CI/CD)
- Use Docker with your Chef Cookbooks and Puppet Manifests(remember, Docker doesn’t do configuration management).
What Alternatives Are There to Docker?
- The Amazon AMI Marketplaceis the closest thing to the Docker Index that you will find. With AMIs, you can only run them on Amazon. With Docker, you can run the images on any Linux server that runs Docker.
- The Warden projectis a LXC manager written for Cloud Foundry without any of the social features of Docker like sharing images with other people on the Docker Index.
How Docker Is Like Java
Java’s promise: Write Once. Run Anywhere.
Docker has the same promise. Except instead of code, you can configure your servers exactly the way you want them (pick the OS, tune the config files, install binaries, etc.) and you can be certain that your server template will run exactly the same on any host that runs a Docker server.
For example, in Java, you write some code:
************************************************************************************
class HelloWorldApp {
public static void main(String[] args) {
System.out.println(“Hello World!”);
}
}
***********************************************************************************
Then run javac HelloWorld.java. The resulting HelloWorld.class can be run on any machine with a JVM.
In Docker, you write a Dockerfile:
**************************************************************************
$ FROM ubuntu:13.10
$ ENV DEBIAN_FRONTEND noninteractive
$ RUN apt-get update -qq -y &&
$ apt-get install curl -qq -y &&
$ apt-get clean
***************************************************************************
$ RUN curl -sSL https://get.rvm.io | bash -s stable –ruby=2.1.1
Then run docker build -t my/ruby . and the resulting container, my/ruby can be run on any machine with a Docker server.
The Docker server is like a JVM for systems. It lets you get around the leaky abstraction of Virtual Machines by giving you an abstraction that runs just above virtualization (or even bare metal).
How Docker Is Like Git
Git’s promise: Tiny footprint with lightning fast performance.
Docker has the same promise. Except instead of for tracking changes in code, you can track changes in systems. Git outclasses SCM tools like Subversion, CVS, Perforce, and ClearCase with features like cheap local branching, convenient staging areas, and multiple workflows. Docker outclasses other tools with features like ultra-fast container startup times (microseconds, not minutes), convenient image building tools, and collaboration workflows.
For example, in Git you make some change and can see changes with git status:
*********************************************************************************
$ git init .
$ touch README.md
$ git add .
$ git status
On branch master
Initial commit
**********************************************************************************
Changes to be committed: (use “git rm –cached …” to unstage)
Add new file README.md to git…
***********************************************************************************
$ git commit -am “Adding README.md”
[master (root-commit) 78184aa] Adding README.md
1 file changed, 0 insertions(+), 0 deletions(-)
create mode 100644 README.md
************************************************************************************
Push change to git repo…
*****************************git push command*************************************
$ git push
Counting objects: 49, done.
Delta compression using up to 4 threads.
Compressing objects: 100% (39/39), done.
Writing objects: 100% (49/49), 4.29 KiB | 0 bytes/s, done.
Total 49 (delta 13), reused 0 (delta 0)
To git@github.com:my/repo.git
* [new branch] master -> master
***********************************************************************************
Branch master set up to track remote branch master from origin…
*******************git pull commannd***************************************
$ git pull
remote: Counting objects: 4, done.
remote: Compressing objects: 100% (3/3), done.
remote: Total 3 (delta 0), reused 0 (delta 0)
Unpacking objects: 100% (3/3), done.
From github.com:cardmagic/docker-ruby
f98f3ac..4578f21 master -> origin/master
Updating f98f3ac..4578f21
Fast-forward
README.md | 3 +++
1 file changed, 3 insertions(+)
create mode 100644 README.md
*************************************************************************************
Use git whatchanged commmand to see what changed…
******************** git whatchanged commmand ************************************
$ git whatchanged
commit 78184aa2a04b4a9fefb13d534d157ef4ac7e81b9
Author: Lucas Carlson
Date: Mon Apr 21 16:46:34 2014 -0700
Adding README.md
:000000 100644 0000000… e69de29… A README.md
*************************************************************************************
In Docker, you can track changes throughout your entire system:
_________________________________________________________________________________________
$ MY_DOCKER=$(docker run -d ubuntu bash -c ‘touch README.md; sleep 10000’)
$ docker diff $MY_DOCKER
A /README.md
C /dev
C /dev/core
C /dev/fd
C /dev/ptmx
C /dev/stderr
C /dev/stdin
C /dev/stdout
___________________________________________________________________________________________
Github commit…command
********************Git commit…command *****************************************
$ docker commit -m “Adding README.md” $MY_DOCKER my/ubuntu
4d46072299621b8e5409cbc5d325d5ce825f788517101fe63f5bda448c9954da
*************************************************************************************
Docker push to update repo…
************************************************************************************
$ docker push my/ubuntu
The push refers to a repository [my/ubuntu] (len: 1)
Sending image list
Pushing repository my/ubuntu (1 tags)
511136ea3c5a: Image already pushed, skipping
Image 6170bb7b0ad1 already pushed, skipping
Image 9cd978db300e already pushed, skipping
de2fdfc8f7d8: Image successfully pushed
Pushing tag for rev [de2fdfc8f7d8] on {https://registry-1.docker.io/v1/repositories/my/ubuntu/tags/latest}
*******************************************************************************
Docker pull to get image…
********* docker pull command ***********************************************
$ docker pull my/ubuntu
Pulling repository my/ubuntu
de2fdfc8f7d8: Download complete
511136ea3c5a: Download complete
6170bb7b0ad1: Download complete
9cd978db300e: Download complete
************************************************************************************
Docker history to see recent changes…
**************************** docker history command ********************************
$ docker history my/ubuntu
IMAGE CREATED CREATED BY SIZE
de2fdfc8f7d8 3 minutes ago bash -c touch README.md; sleep 10000 77 B
9cd978db300e 11 weeks ago /bin/sh -c #(nop) ADD precise.tar.xz in / 204.4 MB
6170bb7b0ad1 11 weeks ago /bin/sh -c #(nop) MAINTAINER Tianon Gravi
*************************************************************************************
These collaboration features (docker push and docker pull) are one of the most disruptive parts of Docker. The fact that any Docker image can run on any machine running Docker is amazing. But The Docker pull/push are the first time developers and ops guys have ever been able to easily collaborate quickly on building infrastructure together. The developers can focus on building great applications and the ops guys can focus on building perfect service containers. The app guys can share app containers with ops guys and the ops guys can share MySQL and PosgreSQL and Redis servers with app guys.
This is the game changer with Docker. That is why Docker is changing the face of development for our generation. The Docker community is already curating and cultivating generic service containers that anyone can use as starting points. The fact that you can use these Docker containers on any system that runs the Docker server is an incredible feat of engineering.
DOCKER Contents(Basic Concepts in Docker):-
Docker images —-> is a lightweight, stand-alone, executable package that includes everything needed to run a piece of software, including the code, a runtime, libraries, environment variables, and config files.
A container——–> is a runtime instance of an image—what the image becomes in memory when actually executed.It runs completely isolated from the host environment by default, only accessing host files and ports if configured to do so.
Dockerfile ——–> will define what goes on in the environment inside your container. Access to resources like networking interfaces and disk drives is virtualized inside this environment, which is isolated from the rest of your system, so you have to map ports to the outside world, and be specific about what files you want to “copy in” to that environment.
However, after doing that, you can expect that the build of your app defined in this Dockerfile will behave exactly the same wherever it runs.
Task —->A single container running in a service is called a task.
What is the use of Docker engine?
Ans”Docker engine” is the part of Docker which creates and runs Docker containers. A Docker container is a live running instance of a Docker image. A Docker image is a file you have created to run a specific service or program in a particular OS.
Who uses dockers?
Docker containers are primarily used by developers and system administrators.
For developers:->
- all focus can be placed on writing the code, rather than worrying about the environment within which it will eventually be deployed.
- There are also a huge number of programs designed to run on docker containers that they can use for their own projects, giving them a sizeable head start.
For system admins:->
1.dockers’ smaller footprint and lower overhead compared to virtual machines means the number of systems required for application deployment can often be reduced.
2.Their portability and ease of installation makes the process far less laborious and enables administrators to regain lost time installing individual components and VMs.
How quick is a docker container, exactly?
When a virtual machine boots, it usually has to retrieve between 10-20GB of operating system data from storage. That can be a painfully slow process by today’s standards, but what about docker containers?
Well,because they don’t have to pull anything other than themselves from the hard disk, they boot within just a fraction of a second. So, they’re quick. Very quick.
****************** Docker Architecture: ************************************
Reference Links:-https://www.tutorialspoint.com/docker/docker_tutorial.pdf
1. Traditional virtualization:
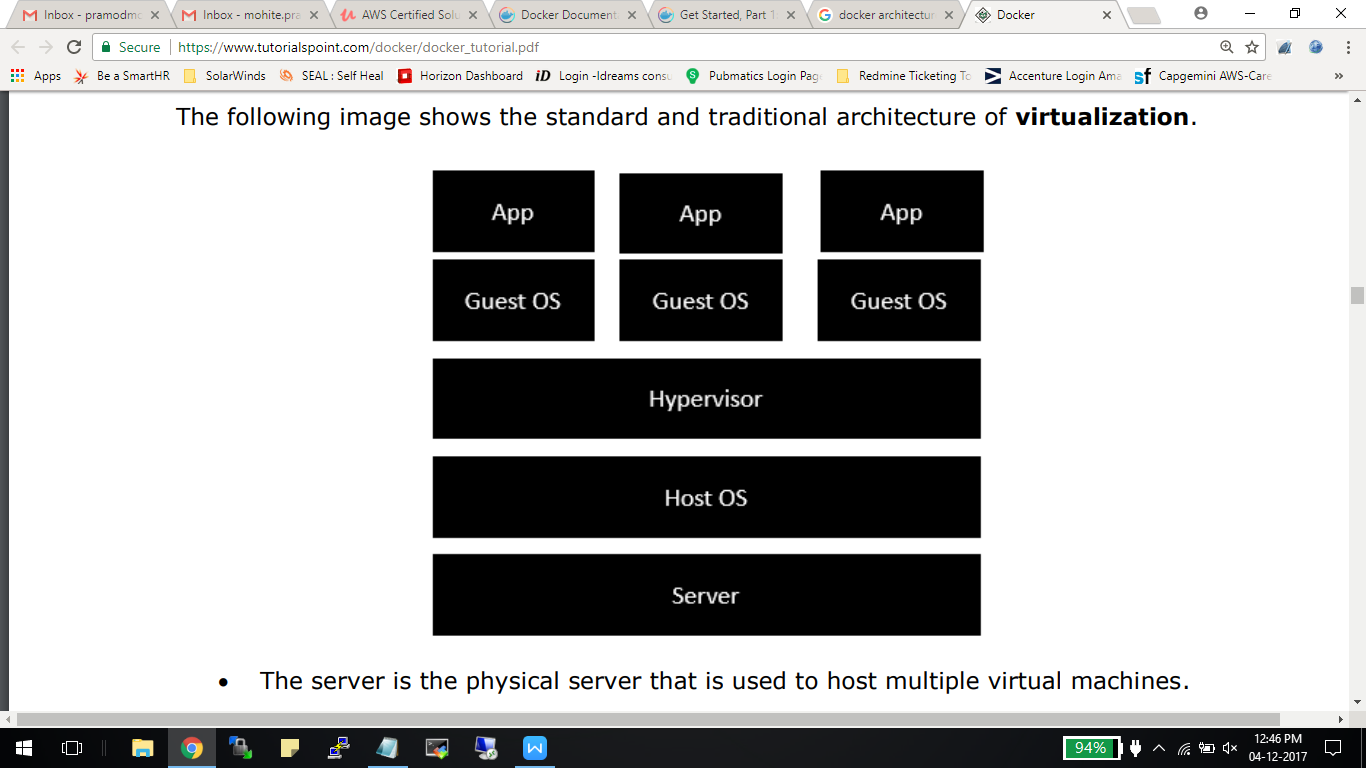
- The Host OS is the base machine such as Linux or Windows. ·
- The Hypervisor is either VMWare or Windows Hyper V that is used to host virtual machines.
- You would then install multiple operating systems as virtual machines on top of the existinghypervisor as Guest OS.
- You would then host your applications on top of each Guest OS.
The following image shows the new generation of virtualization that is enabled via Dockers. Let’s have a look at the various layers.
2. Virtualization enabled via Docker:
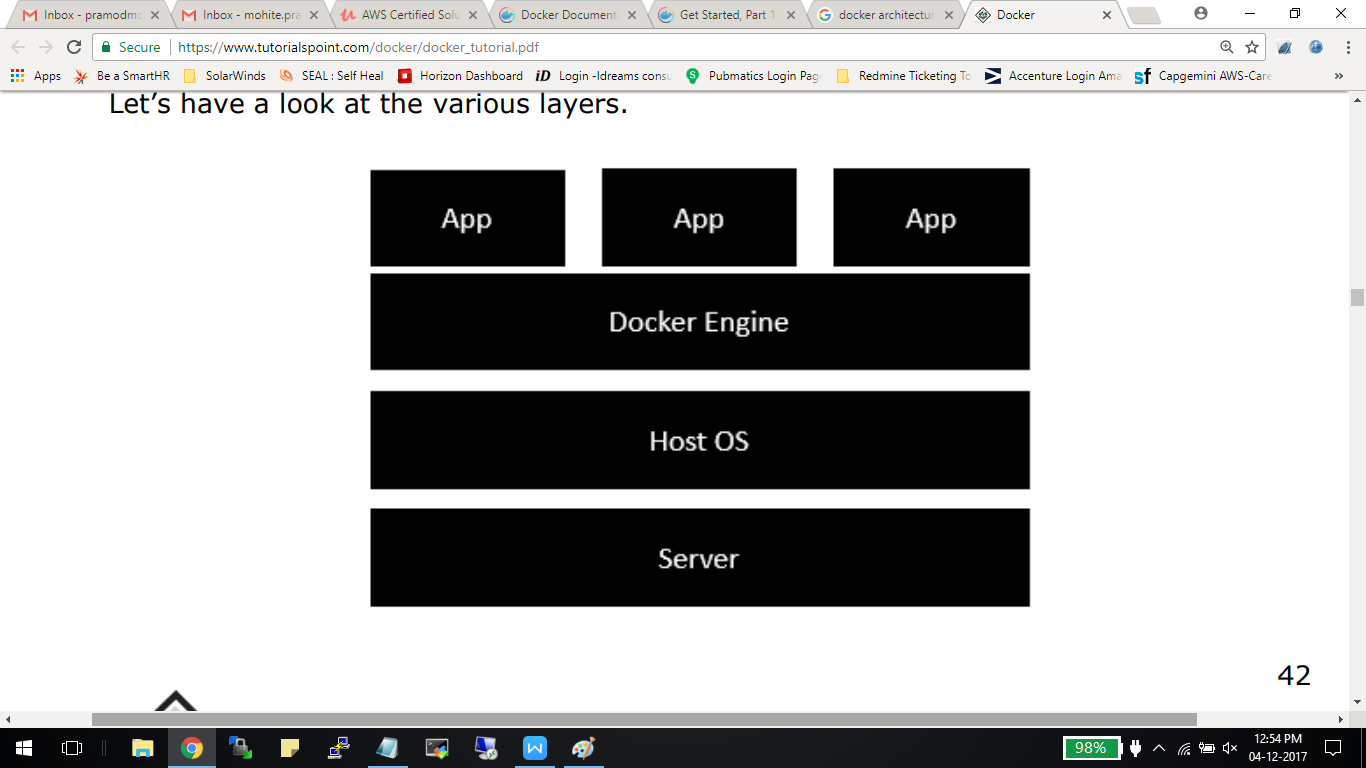
- The server is the physical server that is used to host multiple virtual machines. So this layer remains the same.
- The Host OS is the base machine such as Linux or Windows. So this layer remains the same. ·
- Now comes the new generation which is the Docker engine. This is used to run the operating system which earlier used to be virtual machines as Docker containers.
- All of the Apps now run as Docker containers. The clear advantage in this architecture is that you don’t need to have extra hardware for Guest OS. Everything works as Docker containers.
Installation of Docker On Ubuntu:-
To start the installation of Docker, we are going to use an Ubuntu instance.
You can use Oracle Virtual Box to setup a virtual Linux instance, in case you don’t have it already.
The following screenshot shows a simple Ubuntu server which has been installed on Oracle Virtual Box. There is an OS user named demo which has been defined on the system having entire root access to the sever. To install Docker, we need to follow the steps given below
Step 1: Before installing Docker, you first have to ensure that you have the right Linux kernel version running. Docker is only designed to run on Linux kernel version 3.8 and higher. We can do this by running the following command:
Uname
This method returns the system information about the Linux system. Syntax :
uname -a
Options a – This is used to ensure that the system information is returned. Return Value This method returns the following information on the Linux system:
- kernel name
- node name ·
- kernel release ·
- kernel version ·
- machine ·
- processor ·
- hardware platform ·
- operating system
For Example:
uname -a
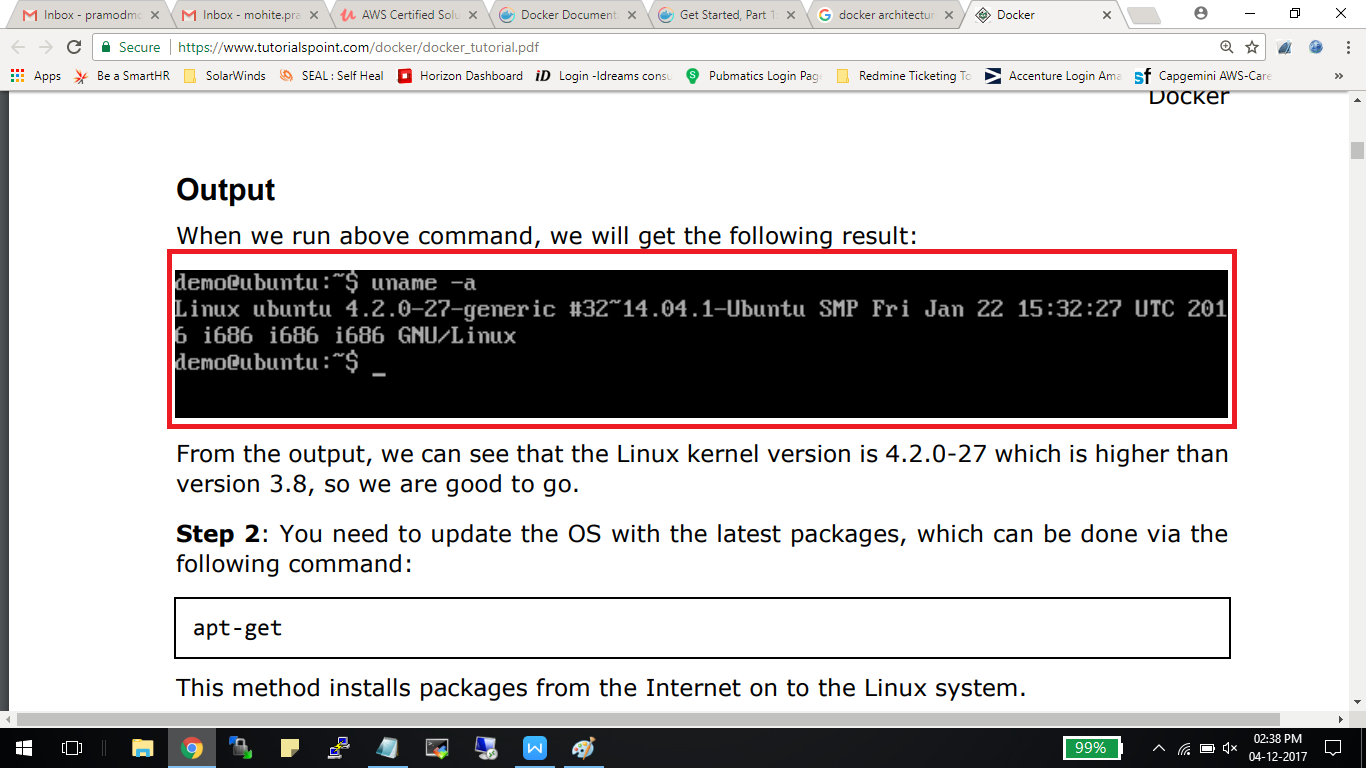
From the output, we can see that the Linux kernel version is 4.2.0-27 which is higher than version 3.8, so we are good to go.
Step 2:
You need to update the OS with the latest packages, which can be done via the following command:
apt-get
This method installs packages from the Internet on to the Linux system.
Syntax
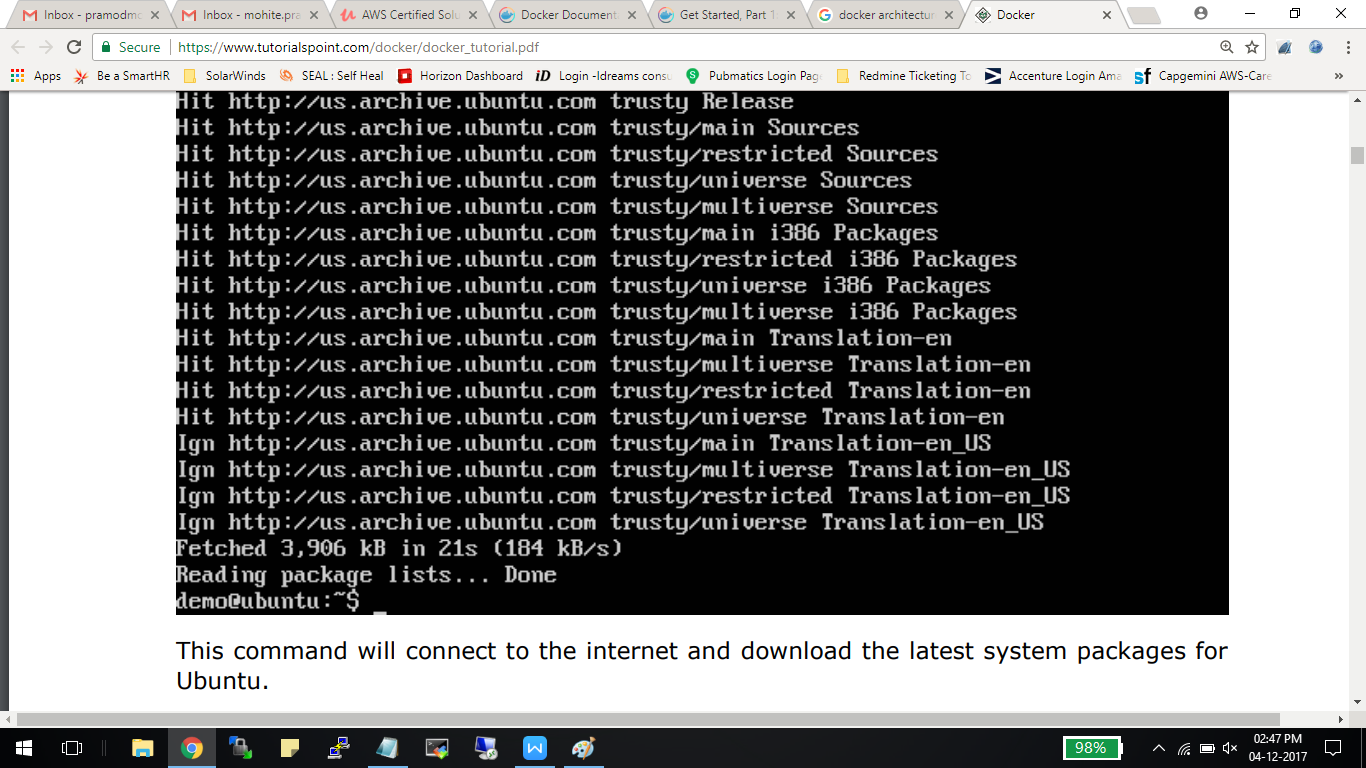
sudo apt-get update
Options
- sudo – The sudo command is used to ensure that the command runs with root access.
- update – The update option is used ensure that all packages are updated on the Linux system.
Return Value None
Output :
When we run the above command, we will get the following result:
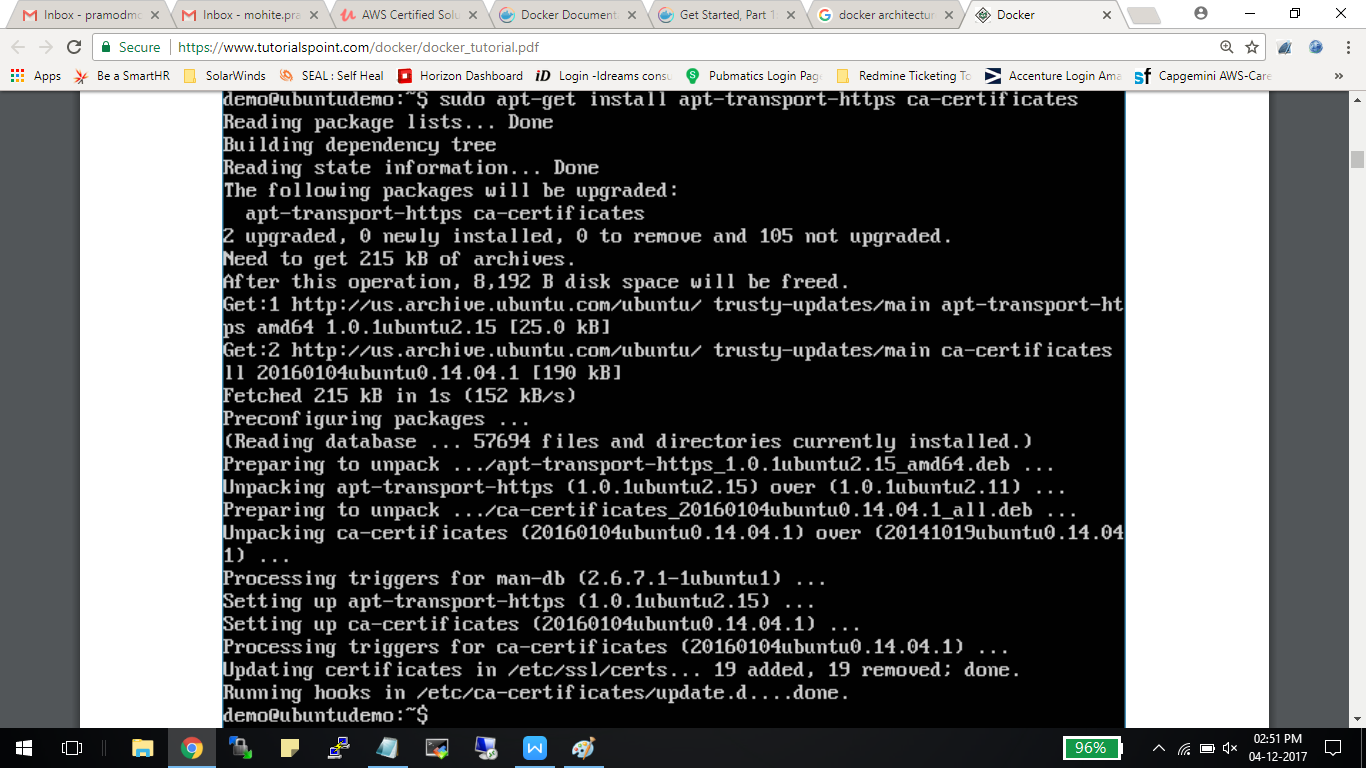
Step 3: The next step is to install the necessary certificates that will be required to work with the Docker site later on to download the necessary Docker packages. It can be done with the following command:
$ sudo apt-get install apt-transport-https ca-certificates
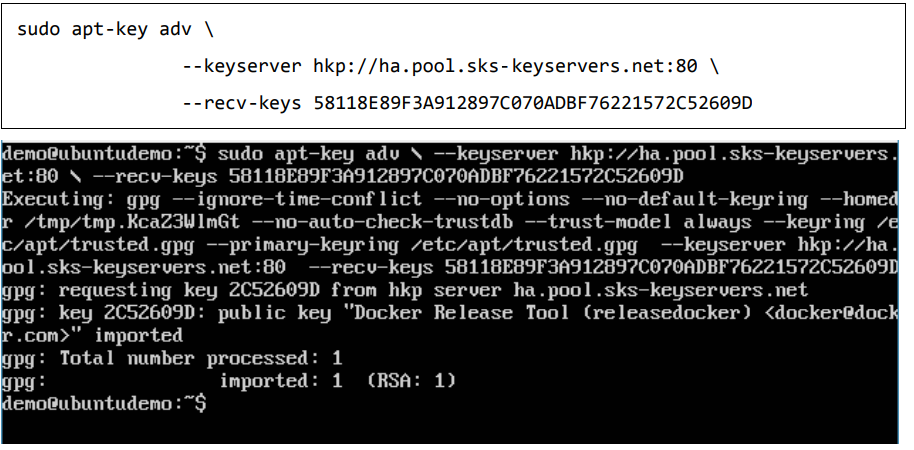
Step 4:
The next step is to add the new GPG key. This key is required to ensure that all data is encrypted when downloading the necessary packages for Docker. The following command will download the key with the ID 58118E89F3A912897C070ADBF76221572C52609D from the keyserver hkp://ha.pool.sks-keyservers.net:80 and adds it to the adv keychain. Please note that this particular key is required to download the necessary Docker packages.
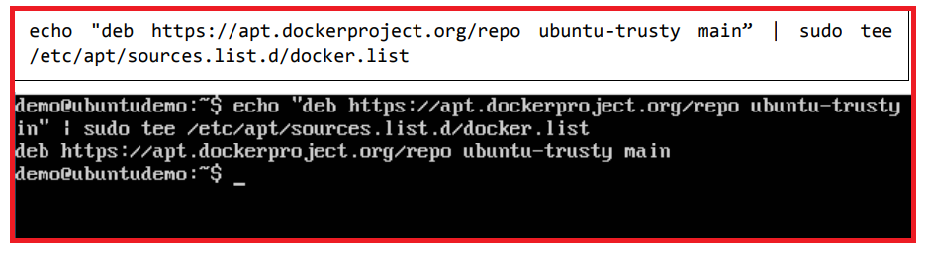
Step 5: Next, depending on the version of Ubuntu you have, you will need to add the relevant site to the docker.list for the apt package manager, so that it will be able to detect the Docker packages from the Docker site and download them accordingly.
And then, we will need to add this repository to the docker.list as mentioned above.
echo “deb https://apt.dockerproject.org/repo ubuntu-trusty main” | sudo tee /etc/apt/sources.list.d/docker.list
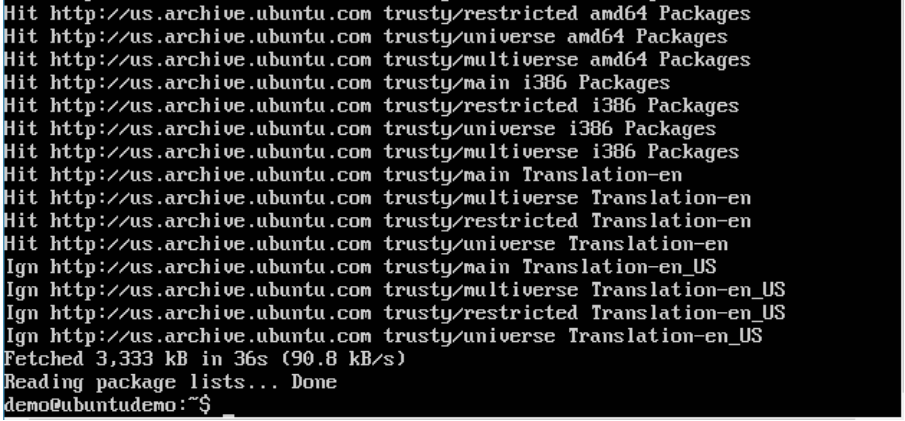
Step 6: Next, we issue the apt-get update command to update the packages on the Ubuntu system.
Step 7: If you want to verify that the package manager is pointing to the right repository, you can do it by issuing the apt-cache command.
apt-cache policy docker-engine
In the output, you will get the link to https://apt.dockerproject.org/repo/
Step 8: Issue the apt-get update command to ensure all the packages on the local system are up to date.
Command: apt-get update
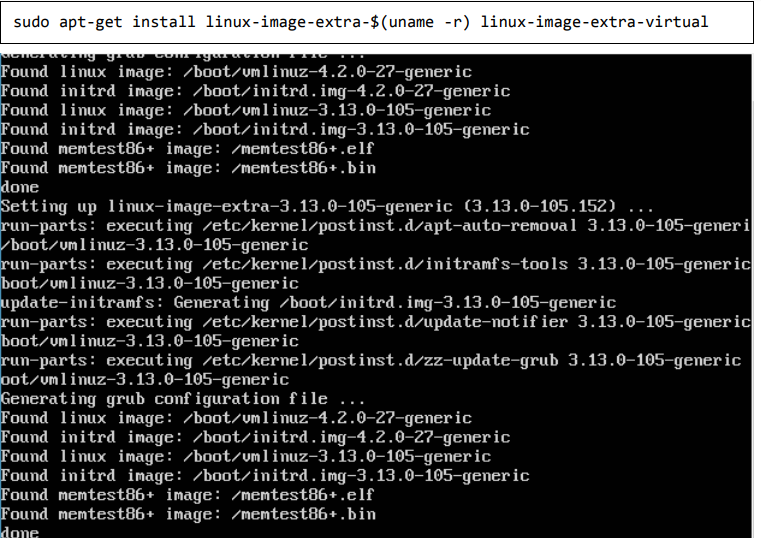
Step 9: For Ubuntu Trusty, Wily, and Xenial, we have to install the linux-image-extra-* kernel packages, which allows one to use the aufs storage driver. This driver is used by the newer versions of Docker. It can be done by using the following command:
Step 10: The final step is to install Docker and we can do this with the following command:
sudo apt-get install –y docker-engine
Here, apt-get uses the install option to download the Docker-engine image from the Docker website and get Docker installed.
The Docker-engine is the official package from the Docker Corporation for Ubuntu-based systems.
In the next section, we will see how to check for the version of Docker that was installed.
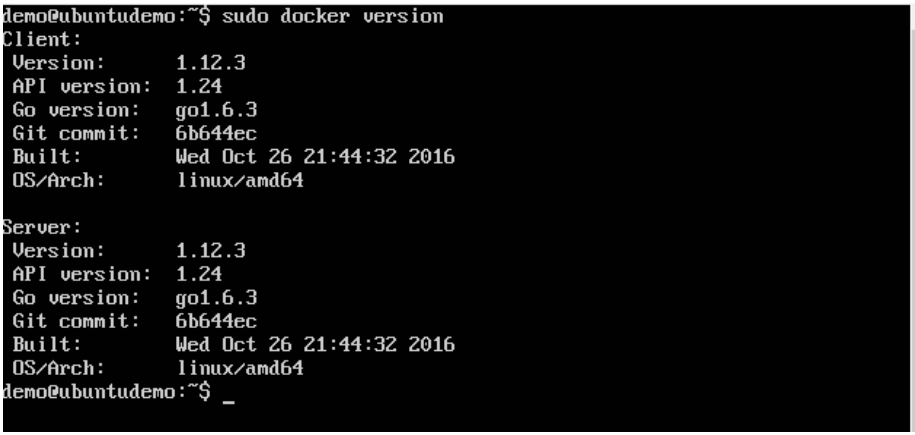
Docker Version :
To see the version of Docker running, you can issue the following command:
$docker version
Options :
version – It is used to ensure the Docker command returns the Docker version installed.
Return Value The output will provide the various details of the Docker version installed on the system.
Output When we run the above program, we will get the following result:
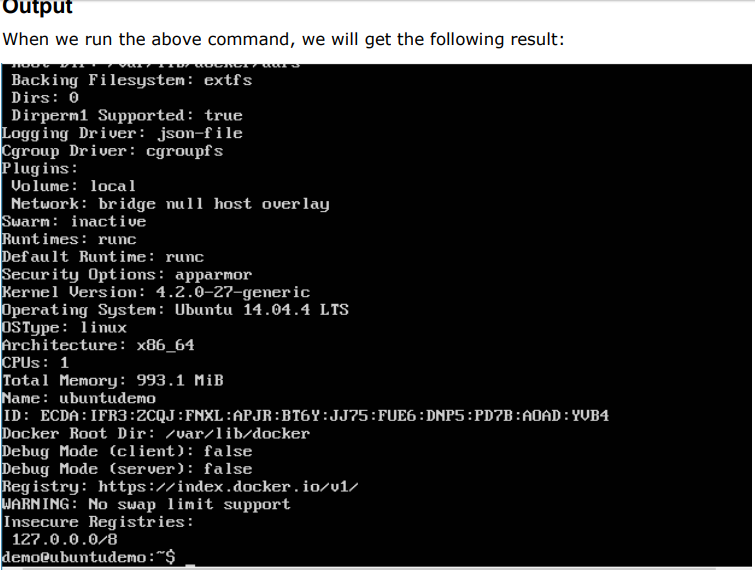
Docker Info:
To see more information on the Docker running on the system, you can issue the following command:
$docker info
Options
- info – It is used to ensure that the Docker command returns the detailed information on the Docker service installed.
Return Value The output will provide the various details of the Docker installed on the system such as
- Number of containers ·
- Number of images ·
- The storage driver used by Docker ·
- The root directory used by Docker ·
- The execution driver used by Docker
Docker Images:
In Docker, everything is based on Images. An image is a combination of a file system and parameters. Let’s take an example of the following command in Docker.
$ docker run hello-world
- The Docker command is specific and tells the Docker program on the Operating System that something needs to be done. ·
- The run command is used to mention that we want to create an instance of an image, which is then called a container. ·
- Finally, “hello-world” represents the image from which the container is made. Now let’s look at how we can use the CentOS image available in Docker Hub to run CentOS on our Ubuntu machine. We can do this by executing the following command on our Ubuntu machine:
$ sudo docker run centos –it /bin/bash
- We are using the sudo command to ensure that it runs with root access.
- Here, centos is the name of the image we want to download from Docker Hub and install on our Ubuntu machine.
- ─it is used to mention that we want to run in interactive mode.
- /bin/bash is used to run the bash shell once CentOS is up and running
To see the list of Docker images on the system
$ docker images
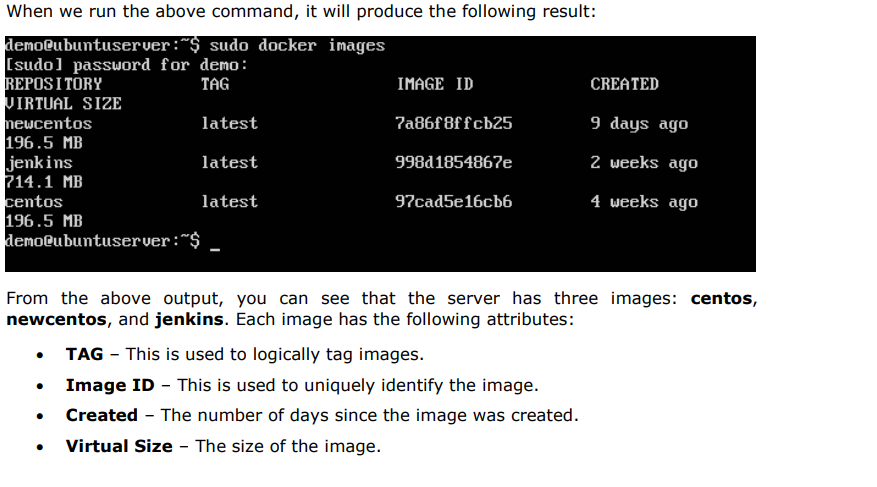
DOCKER Commands—–>
- docker build -t friendlyname . # Create image using this directory’s Dockerfile
- docker run -p 4000:80 friendlyname # Run “friendlyname” mapping port 4000 to 80
- docker run -d -p 4000:80 friendlyname # Same thing, but in detached mode
- docker container ls # List all running containers
- docker container ls -a # List all containers, even those not running
- docker container stop # Gracefully stop the specified container
- docker container kill # Force shutdown of the specified container
- docker container rm # Remove specified container from this machine
- docker container rm $(docker container ls -a -q) # Remove all containers
- docker image ls -a # List all images on this machine
- docker image rm # Remove specified image from this machine
- docker image rm $(docker image ls -a -q) # Remove all images from this machine
- docker login # Log in this CLI session using your Docker credentials
- docker tag username/repository:tag # Tag for upload to registry
- docker push username/repository:tag # Upload tagged image to registry
- docker run username/repository:tag # Run image from a registry
——-To lists the docker containers, use following command ———-
$ docker container ls
$ docker container ls -q
—–To Stop particular container, use following command——-
$ docker container stop
—–Use following command to remove all containers——-
$ docker rm $(docker ps –no-trunc -aq)
—-To Remove all docker images, Use command as——-
$ docker rmi $(docker images -q –filter “dangling=true”)
——Stopping Docker-container using container name—
$ docker stop $(docker ps -a –filter=”name=csm” -q)
$ docker rmi imageID to remove Docker images
$ docker images -q
where,q – It tells the Docker command to return the Image IDs only
$ docker inspect Docker_image_name —-gives details of docker image
Docker Containers:
Containers are instances of Docker images that can be run using the Docker run command. The basic purpose of Docker is to run containers. Let’s discuss how to work with containers.
Running of containers is managed with the Docker run command. To run a container in an interactive mode, first launch the Docker container.
$ sudo docker run –it centos /bin/bash
After running the above command, We will entered into docker container’s root directory.
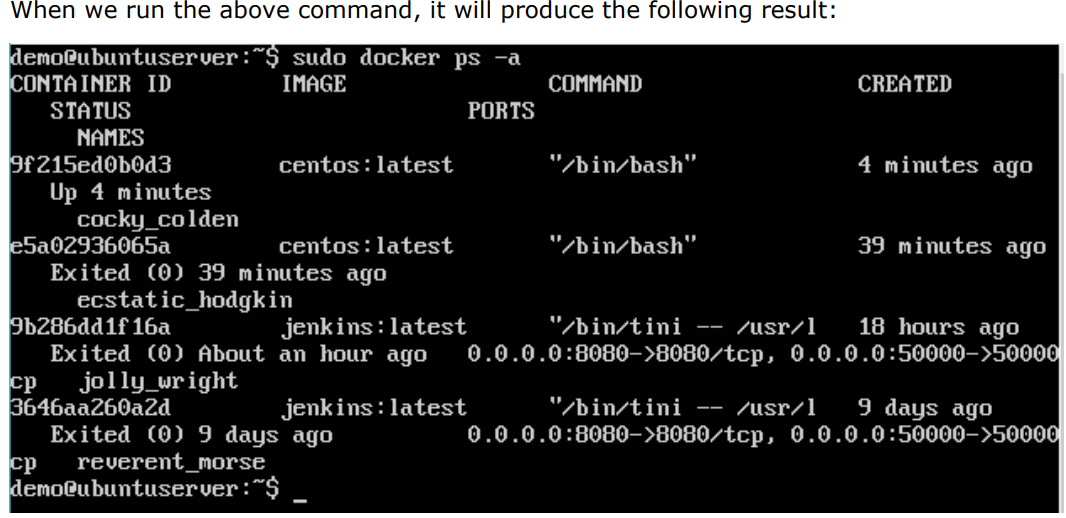
Listing of Containers:
One can list all of the containers on the machine via the docker ps command. This command is used to return the currently running containers.
$ docker ps
The output will show the currently running containers.
$ sudo docker ps -a
Where,”─a” It tells the docker ps command to list all of the containers on the system.
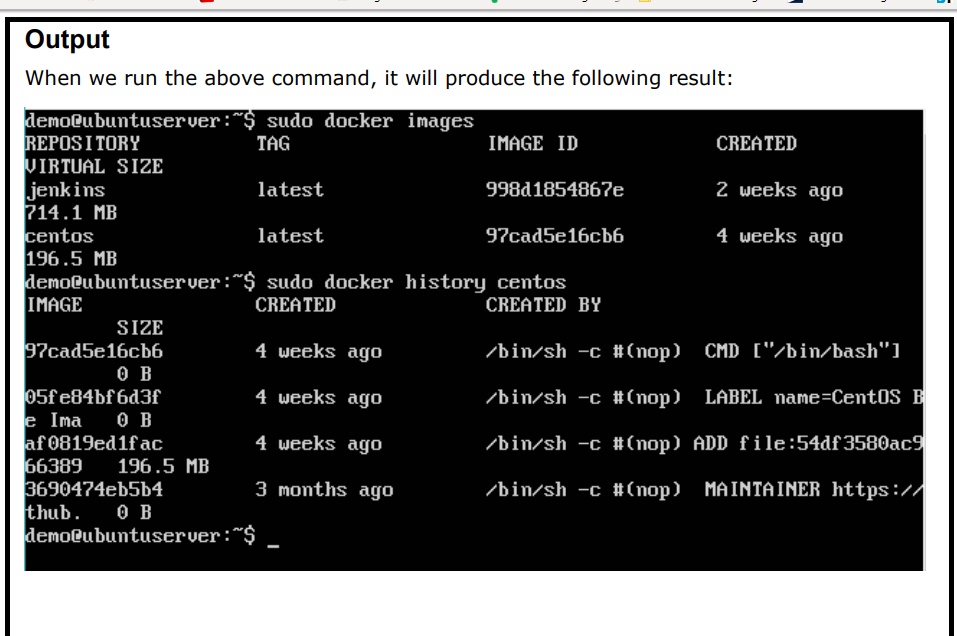
docker history :
With this command, you can see all the commands that were run with an image via a container.
$ docker history ImageID
Docker – Working With Containers:
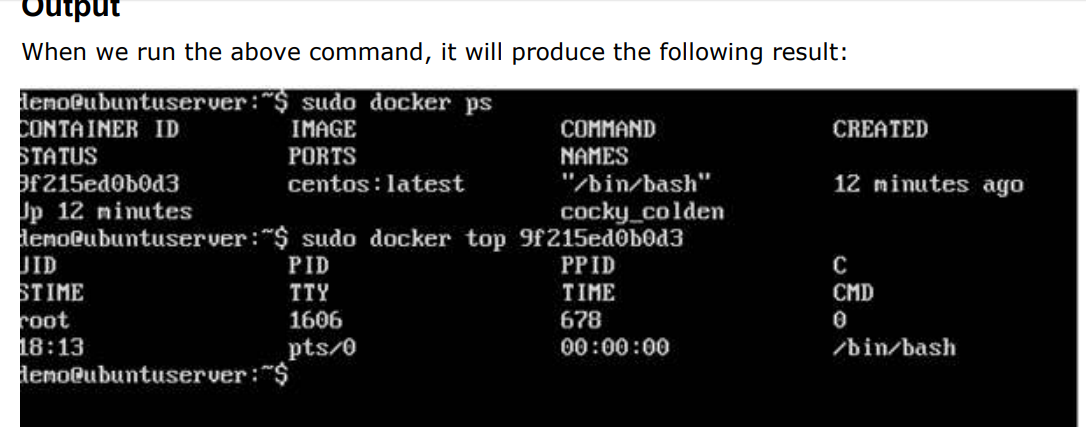
docker top Command :
With this command, you can see the top processes within a container.
$ docker top ContainerID
Where, ContainerID – This is the Container ID for which you want to see the top processes.
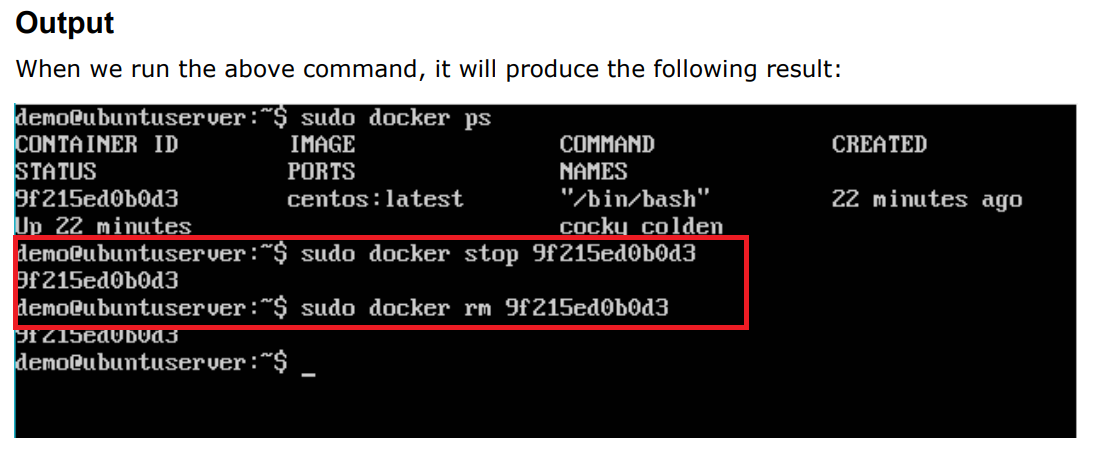
$docker stop ContainerID
$docker rm ContainerID
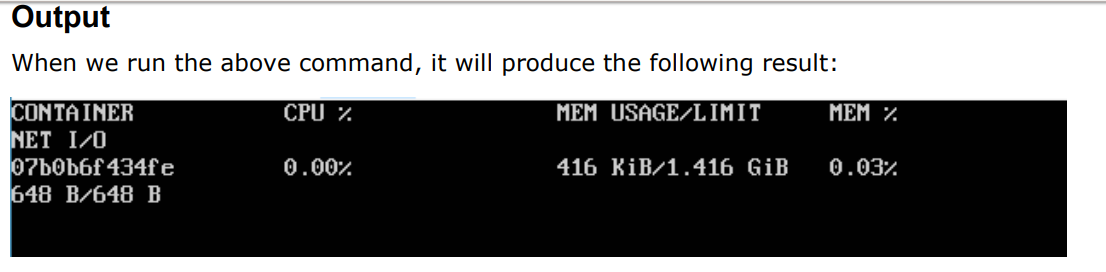
docker stats command:
This command is used to provide the statistics of a running container.
$docker stats ContainerID
Where,
- ContainerID – This is the Container ID for which the stats need to be provided.
Return Value – The output will show the CPU and Memory utilization of the Container.
$sudo docker rm 9f215ed0b0d3
The above command will provide CPU and memory utilization of the Container 9f215ed0b0d3.
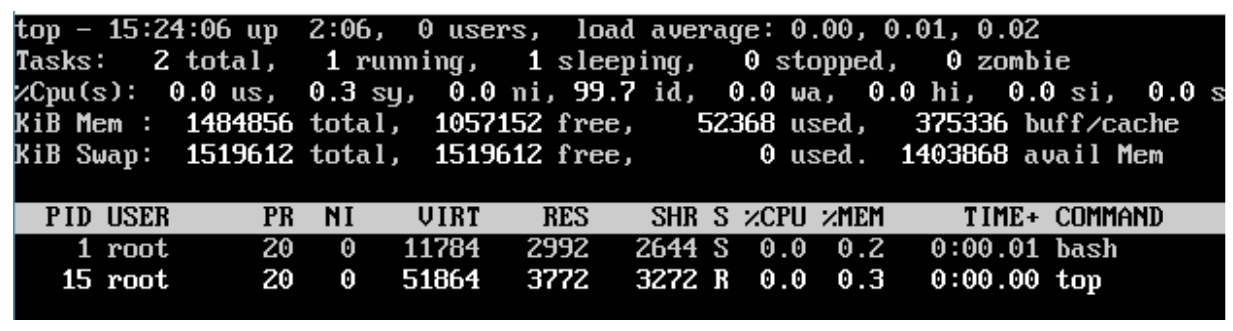
docker attach command:
$ sudo docker attach 07b0b6f434fe
The above command will attach to the Docker container 07b0b6f434fe. Output When we run the above command, it will produce the following result:
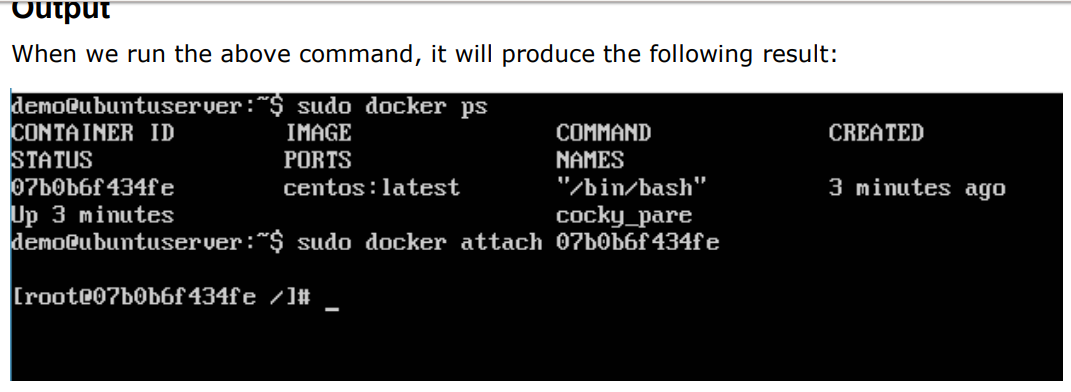
Once you have attached to the Docker container, you can run the above command to see the process utilization in that Docker container.
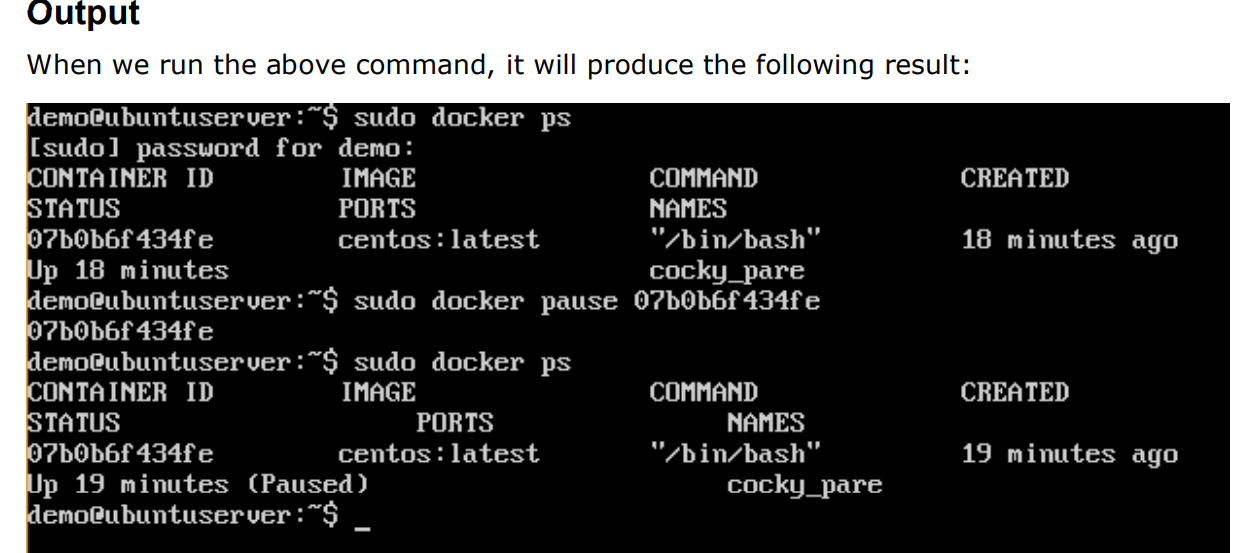
docker pause command:
$sudo docker pause ContainerId
The above command will pause the processes in a running container 07b0b6f434fe.
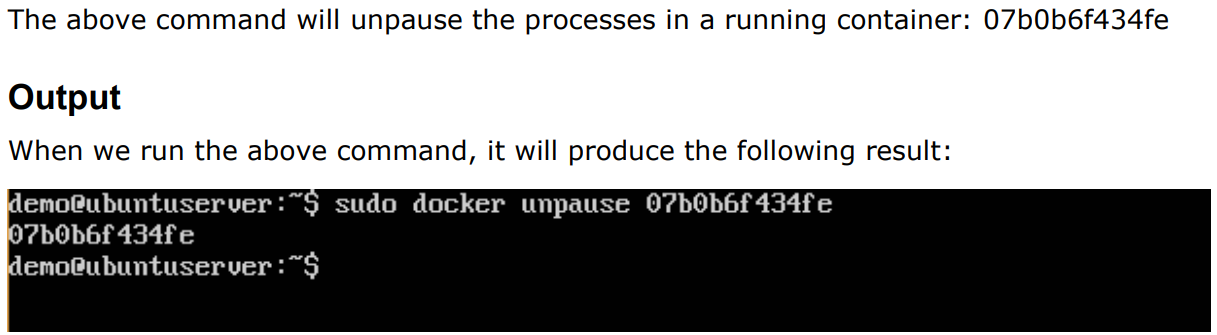
docker unpause command:
$ docker unpause ContainerID
$ sudo docker unpause 07b0b6f434fe
The above command will unpause the processes in a running container: 07b0b6f434fe
Output :
When we run the above command, it will produce the following result:
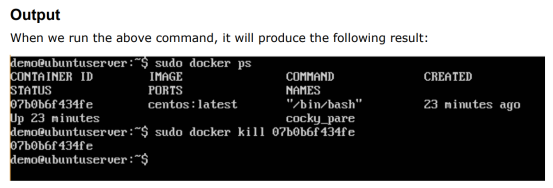
docker kill command:
This command is used to kill the processes in a running container.
$docker kill ContainerID
Where,
ContainerID – This is the Container ID to which you need to kill the processes in the container. Return Value
The ContainerID of the running container.
$ sudo docker kill 07b0b6f434fe
The above command will kill the processes in the running container 07b0b6f434fe
Docker –Container Lifecycle:
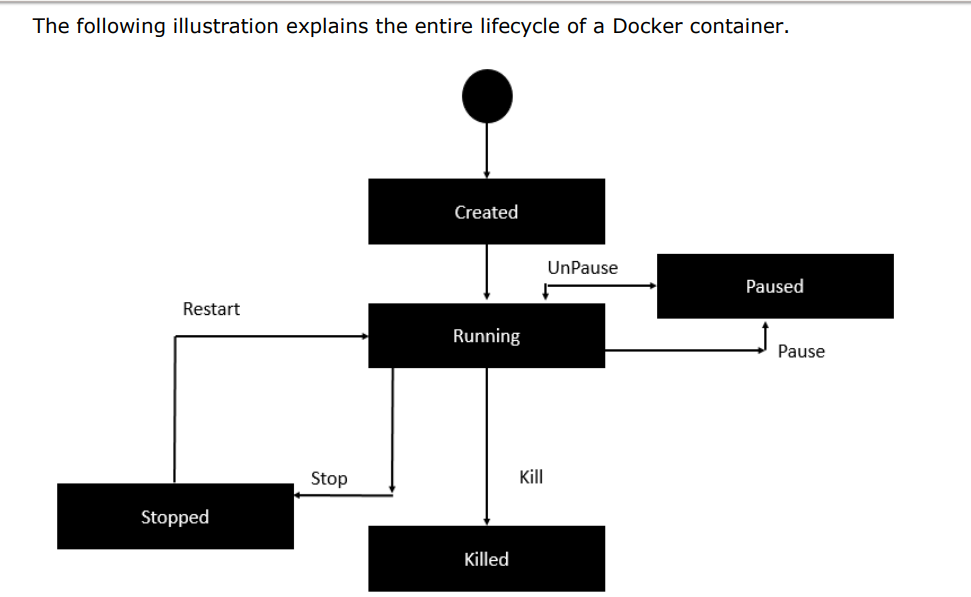
- Initially, the Docker container will be in the created state.
- Then the Docker container goes into the running state when the Docker run command is used. ·
- The Docker kill command is used to kill an existing Docker container. ·
- The Docker pause command is used to pause an existing Docker container.
- The Docker stop command is used to pause an existing Docker container.
- The Docker run command is used to put a container back from a stopped state to a running state.
Docker File:
Step 1: Create a file called Docker File and edit it using vim. Please note that the name of the file has to be “Dockerfile” with “D” as capital.
$ sudo vim Dockerfile
Step 2: Write down the following instruction into that file(Dockerfile)
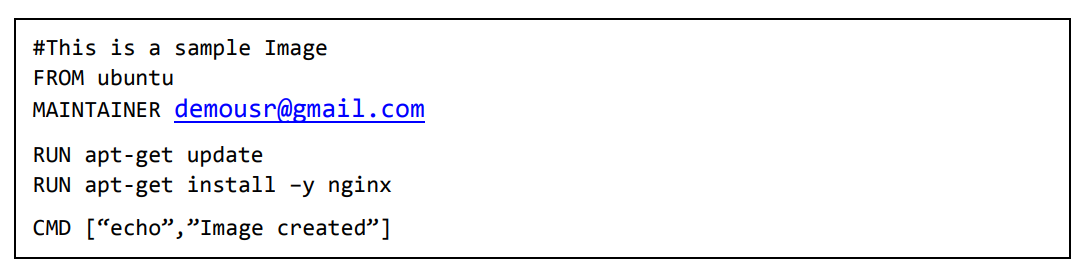
The following points need to be noted about the above file: ·
- The first line “#This is a sample Image” is a comment. You can add comments to the Docker File with the help of the # command.
- The next line has to start with the FROM keyword. It tells docker, from which base image you want to base your image from. In our example, we are creating an image from the ubuntu image.
- The next command is the person who is going to maintain this image. Here you specify the MAINTAINER keyword and just mention the email ID.
- The RUN command is used to run instructions against the image. In our case, we first update our Ubuntu system and then install the nginx server on our ubuntu image.
5.The last command is used to display a message to the user.
Step 3: Save the file. In the next chapter, we will discuss how to build the image.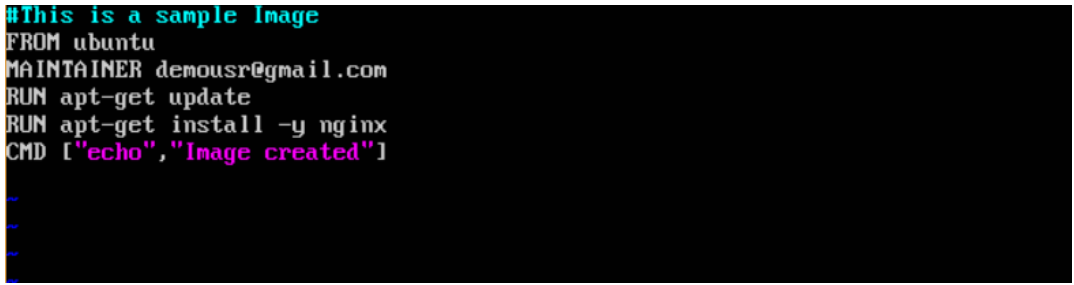
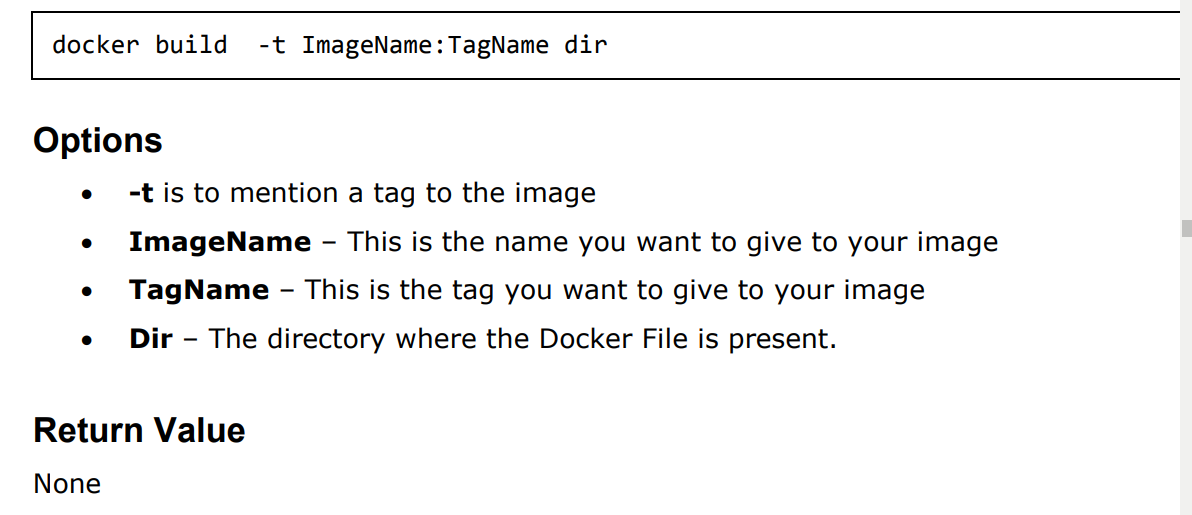
Building Docker File:
Docker build command:
This method allows the users to build their own Docker images.
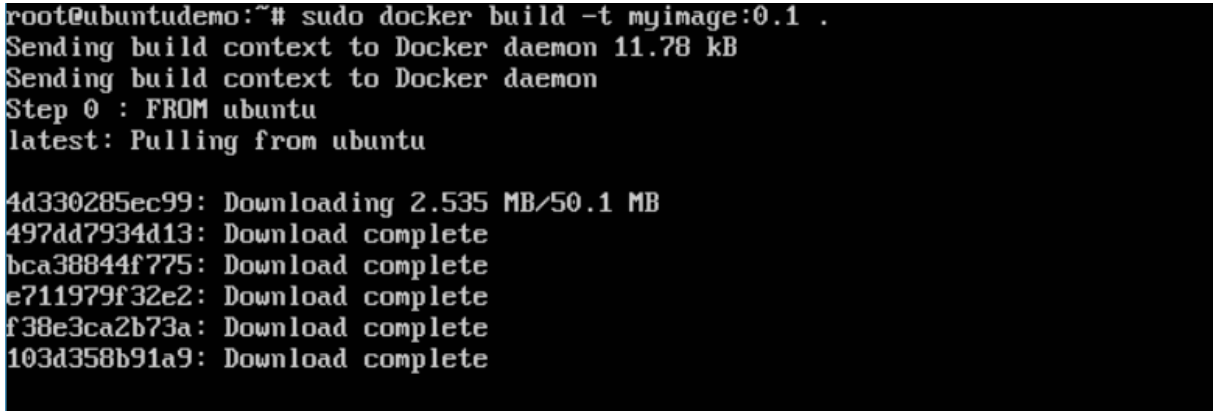
Output:
From the output, you will first see that the Ubuntu Image will be downloaded from Docker Hub, because there is no image available locally on the machine.
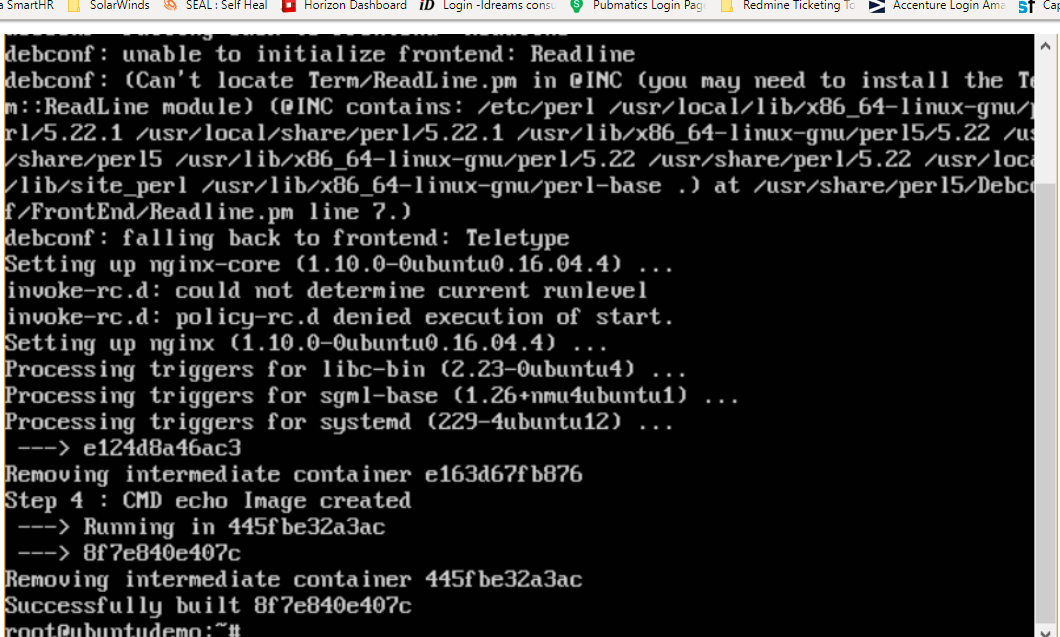
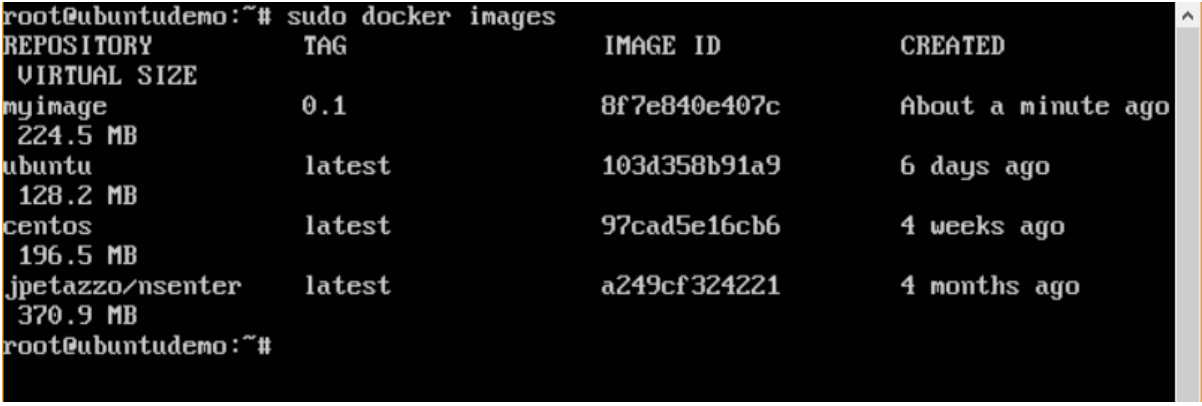
You will then see the successfully built message and the ID of the new Image. When you run the Docker images command, you would then be able to see your new image.
Docker Public Repository:
- Public repositories can be used to host Docker images which can be used by everyone else.
- An example is the images which are available in Docker Hub. Most of the images such as Centos, Ubuntu, and Jenkins are all publicly available for all.
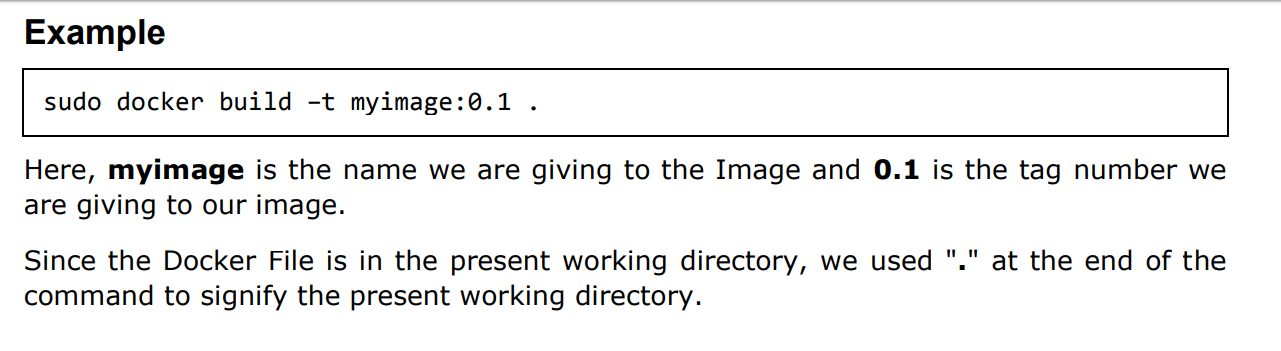
We can also make our images available by publishing it to the public repository on Docker Hub. For our example, we will use the myimage repository built in the “Building Docker Files” chapter and upload that image to Docker Hub.
Let’s first review the images on our Docker host to see what we can push to the Docker registry
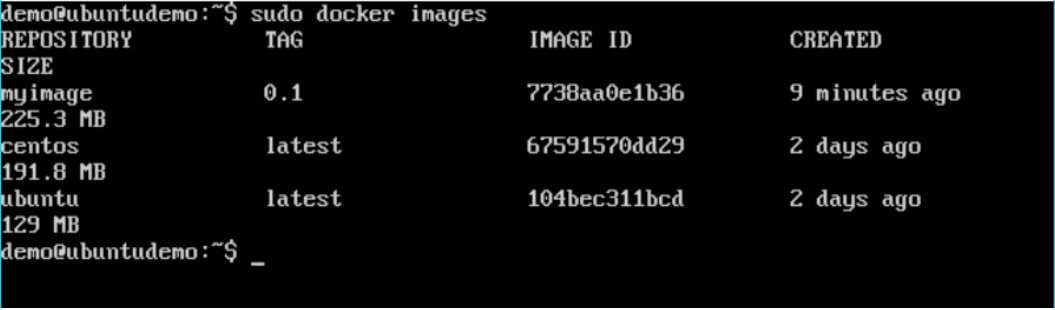
Here, we have our myimage:0.1 image which was created as a part of the “Building Docker Files” chapter. Let’s use this to upload to the Docker public repository. The following steps explain how you can upload an image to public repository.
Docker Public Repository(Content):
1.1 Upload an docker image to public repository :
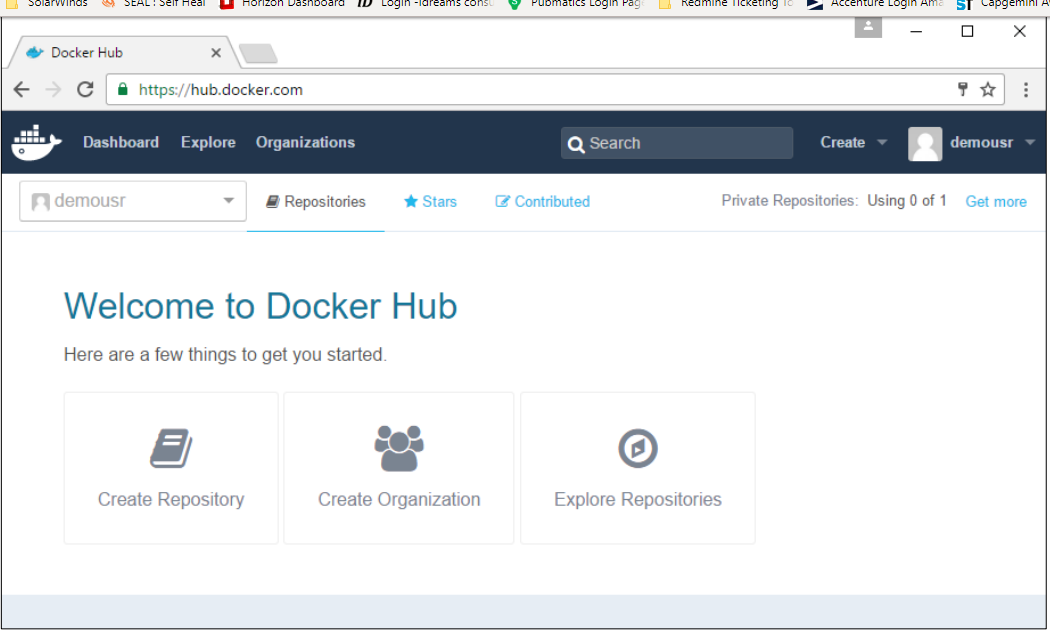
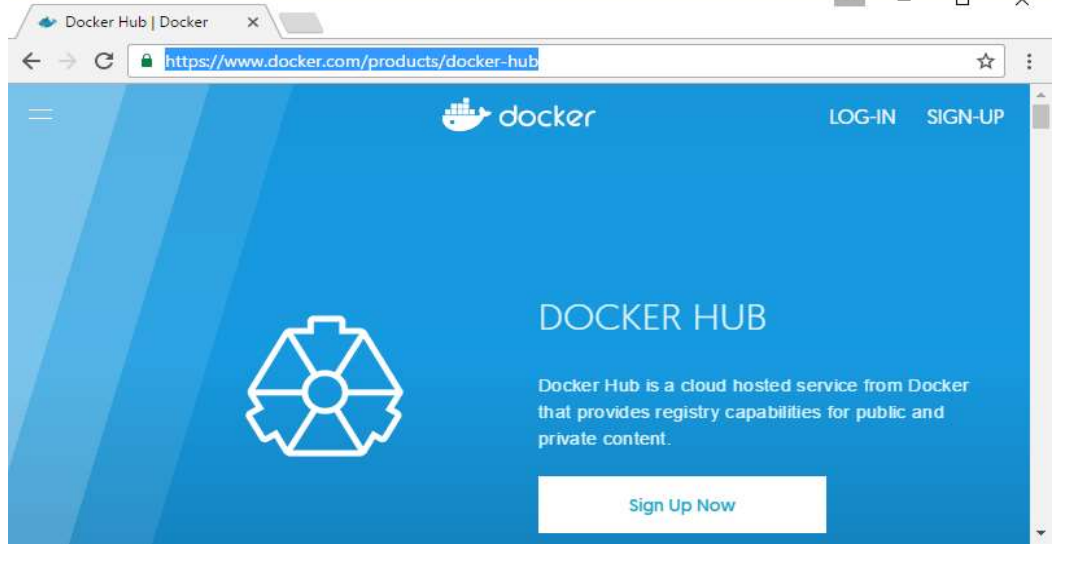
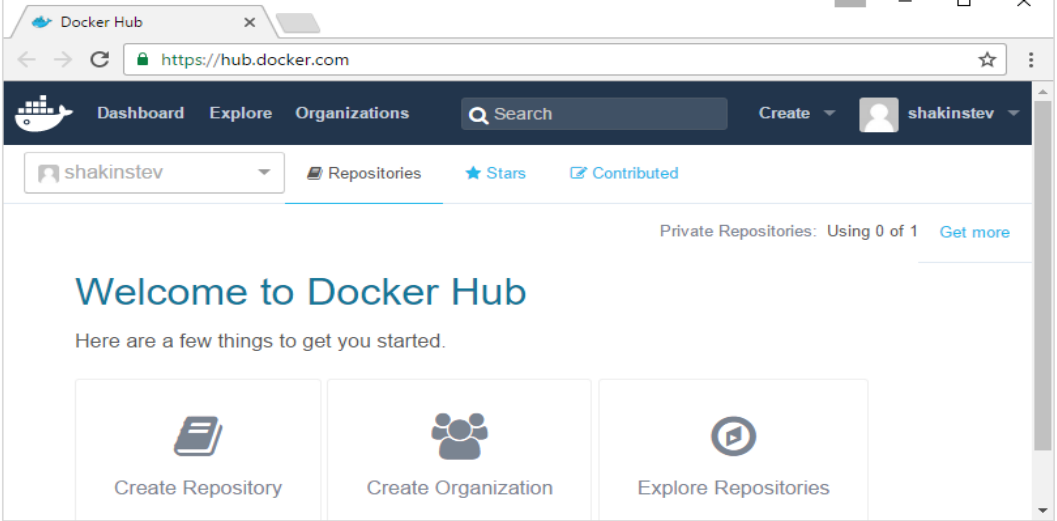
Step 1: Log into Docker Hub and create your repository. This is the repository where your image will be stored. Go to https://hub.docker.com/ and log in with your credentials.
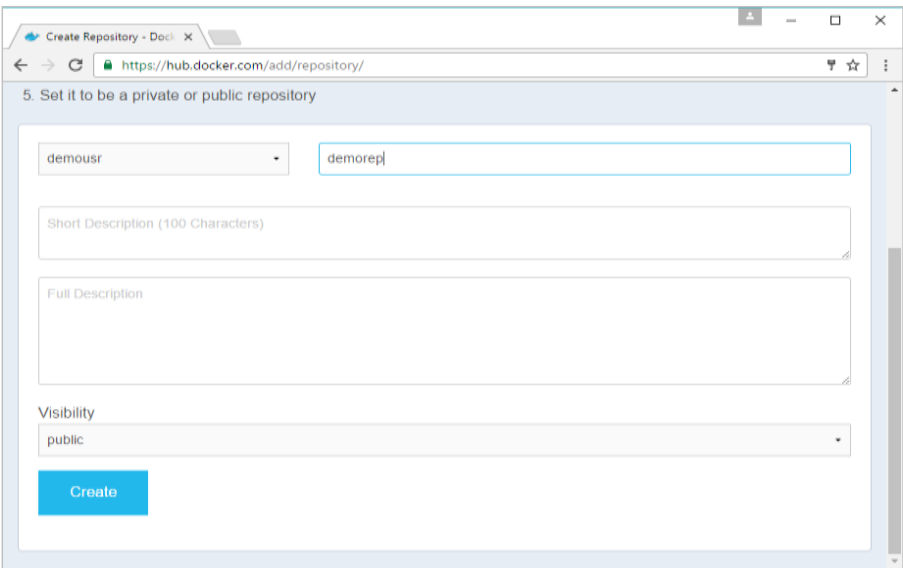
Step 2: Click the button “Create Repository” on the above screen and create a repository with the name demorep. Make sure that the visibility of the repository is public.
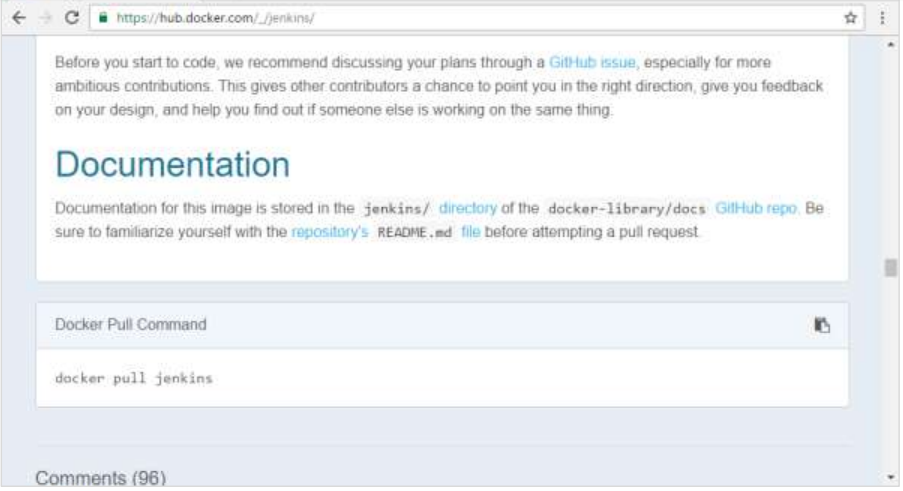
Once the repository is created, make a note of the pull command which is attached to the repository.
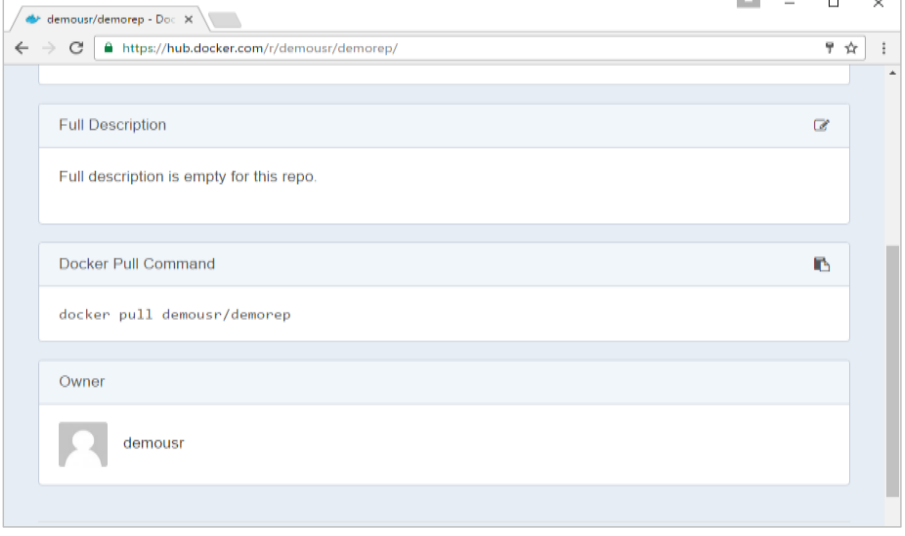
The pull command which will be used in our repository is as follows:
$docker pull demousr/demorep
Step 3: Now go back to the Docker Host. Here we need to tag our myimage to the new repository created in Docker Hub. We can do this via the Docker tag command. We will learn more about this tag command later in this chapter.
Step 4: Issue the Docker login command to login into the Docker Hub repository from the command prompt. The Docker login command will prompt you for the username and password to the Docker Hub repository.
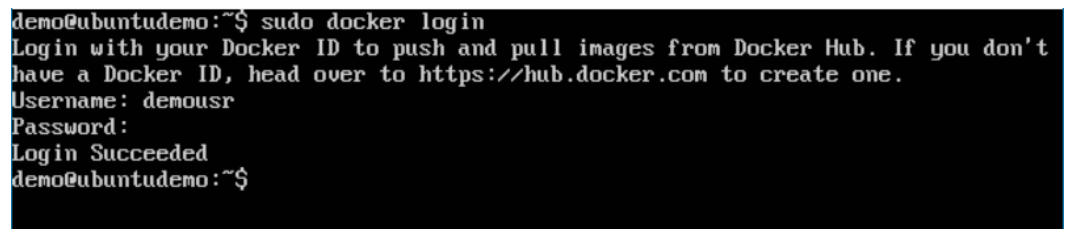
Step 5: Once the image has been tagged, it’s now time to push the image to the Docker Hub repository. We can do this via the Docker push command.
1.2 Docker tag Command:
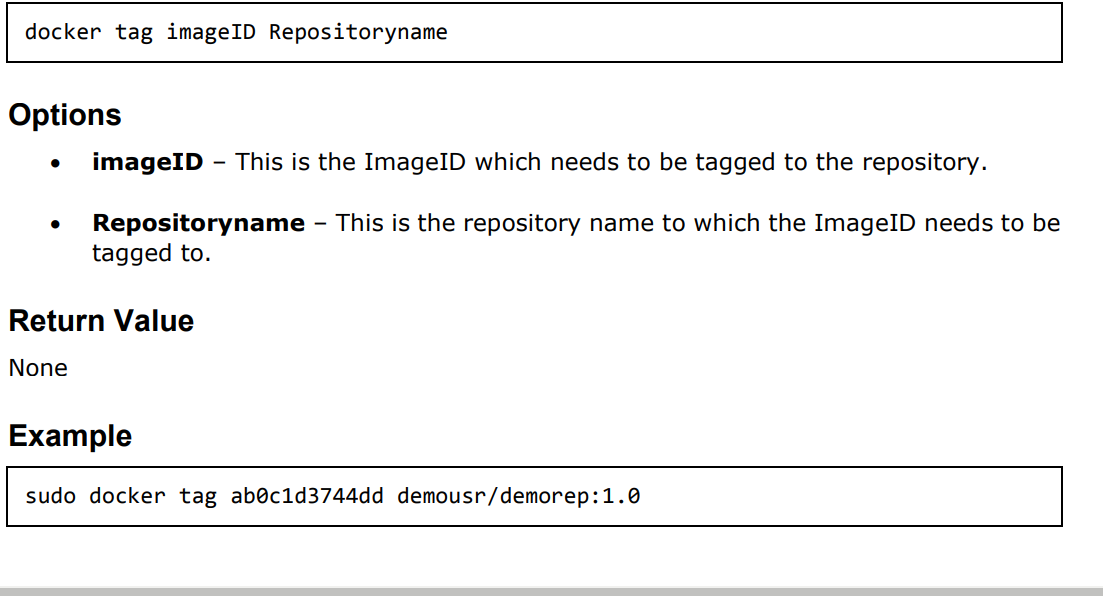
Output:
A sample output of the above example is given below.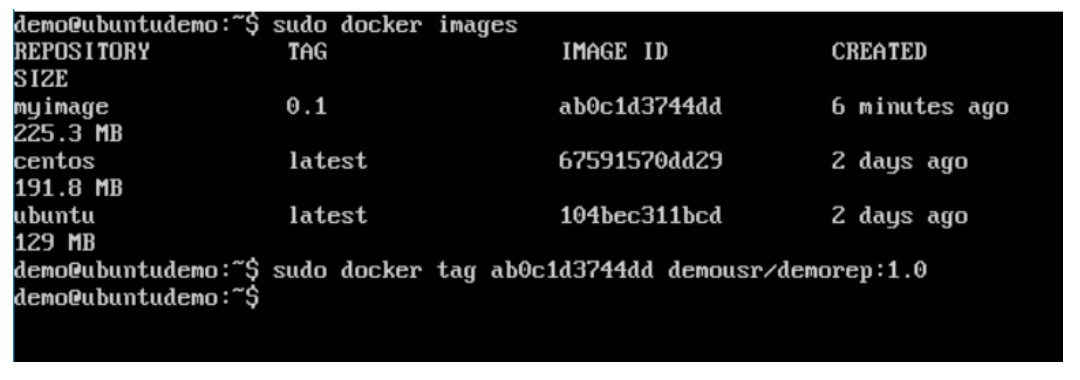
1.3 Docker push command:
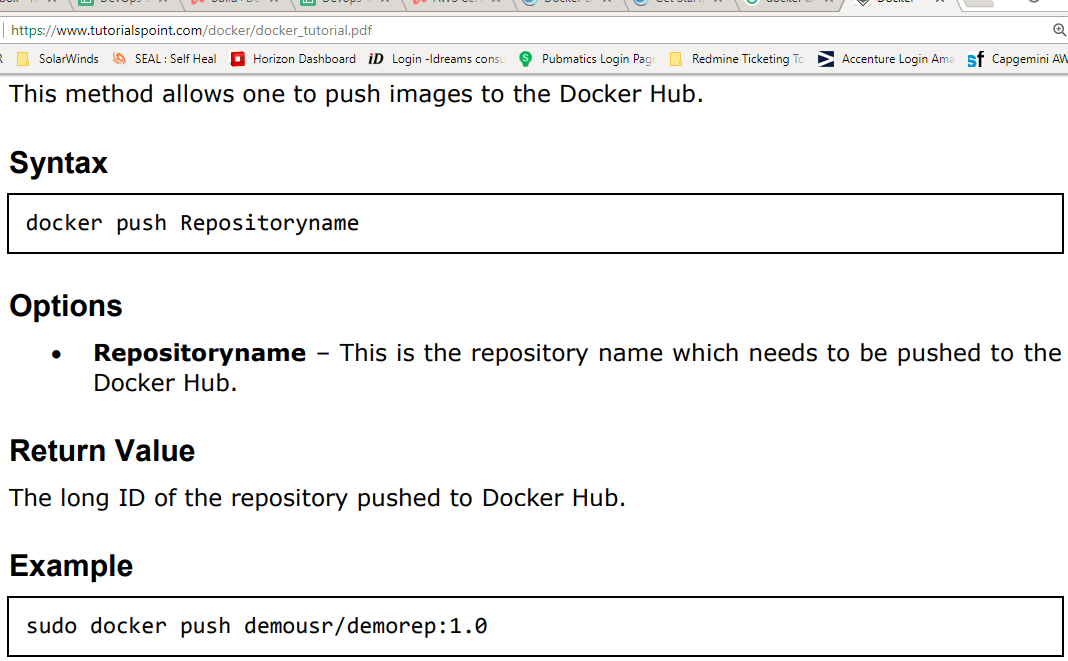
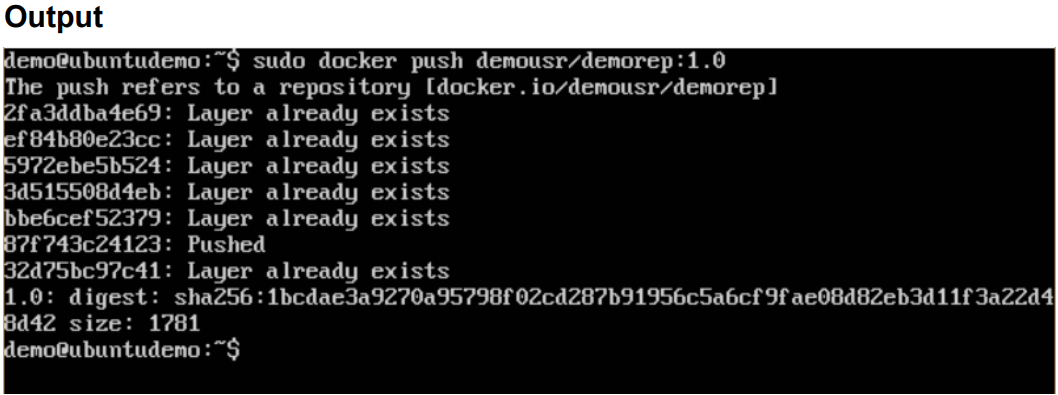
If you go back to the Docker Hub page and go to your repository, you will see the tag name in the repository.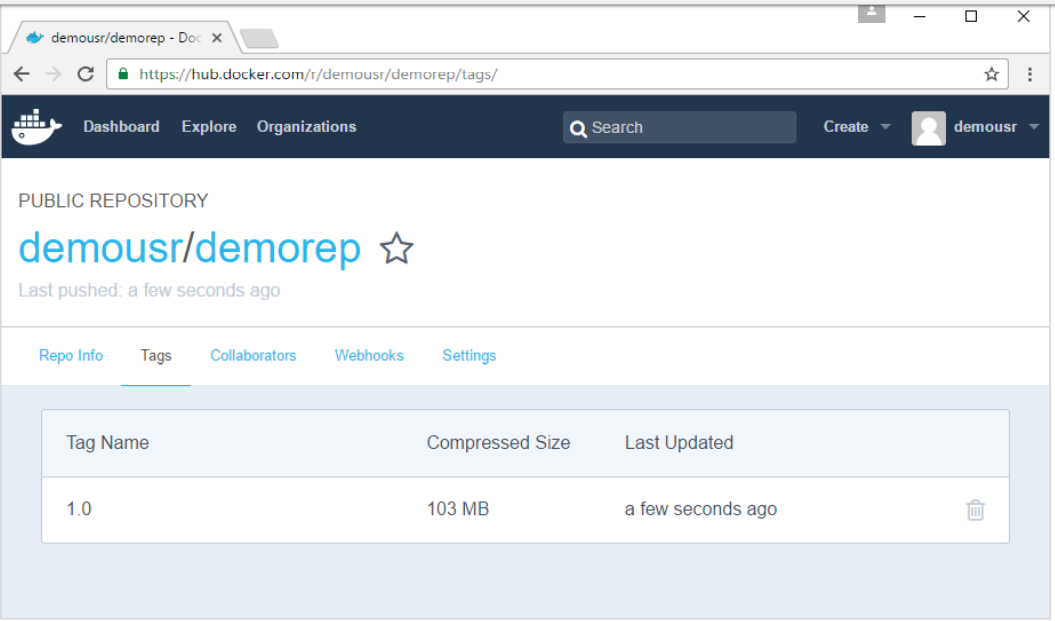
Now let’s try to pull the repository we uploaded onto our Docker host. Let’s first delete the images, myimage:0.1 and demousr/demorep:1.0, from the local Docker host. Let’s use the Docker pull command to pull the repository from the Docker Hub.
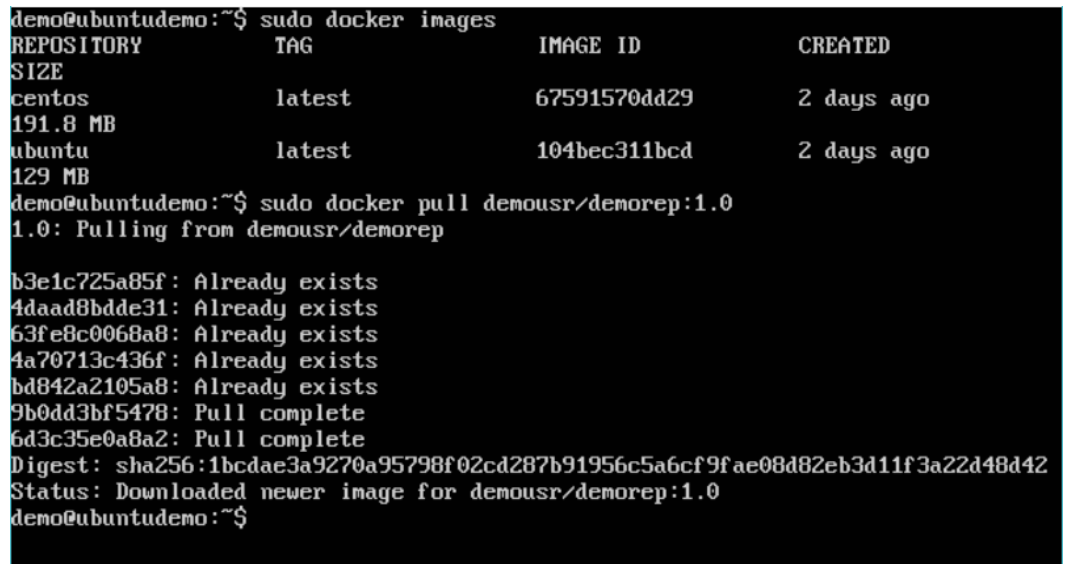
From the above screenshot, you can see that the Docker pull command has taken our new repository from the Docker Hub and placed it on our machine.
Docker Managing Ports:
In Docker, the containers themselves can have applications running on ports. When you run a container, if you want to access the application in the container via a port number, you need to map the port number of the container to the port number of the Docker host. Let’s look at an example of how this can be achieved.
In our example, we are going to download the Jenkins container from Docker Hub. We are then going to map the Jenkins port number to the port number on the Docker host.
Step 1: First, you need to do a simple sign-up on Docker Hub.
 Once you have signed up, you will be logged into Docker Hub.
Step 3: Next, let’s browse and find the Jenkins image.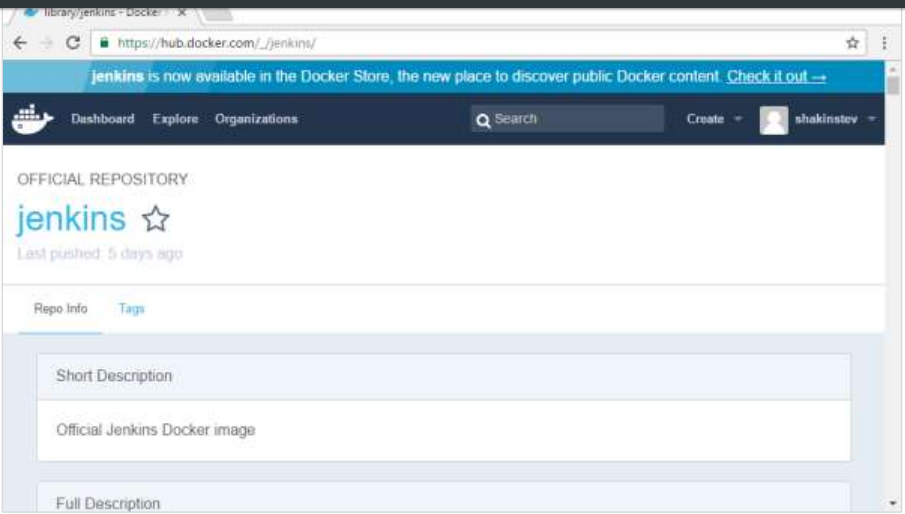
Step 4: If you scroll down on the same page, you can see the Docker pull command. This will be used to download the Jenkins Image onto the local Ubuntu server.
Step 5: Now go to the Ubuntu server and run the command:
$sudo docker pull jenkins
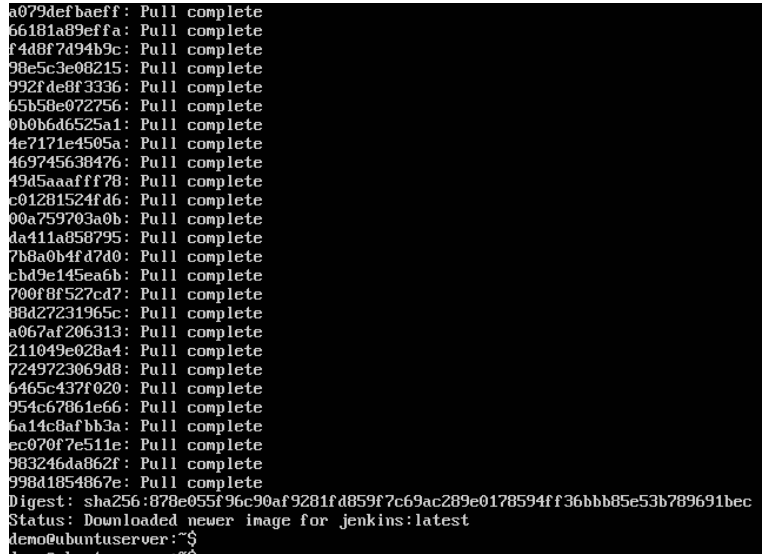
Step 6: To understand what ports are exposed by the container, you should use the Docker inspect command to inspect the image.
Run the following command to get low level information of the image or container in JSON format:
Example:
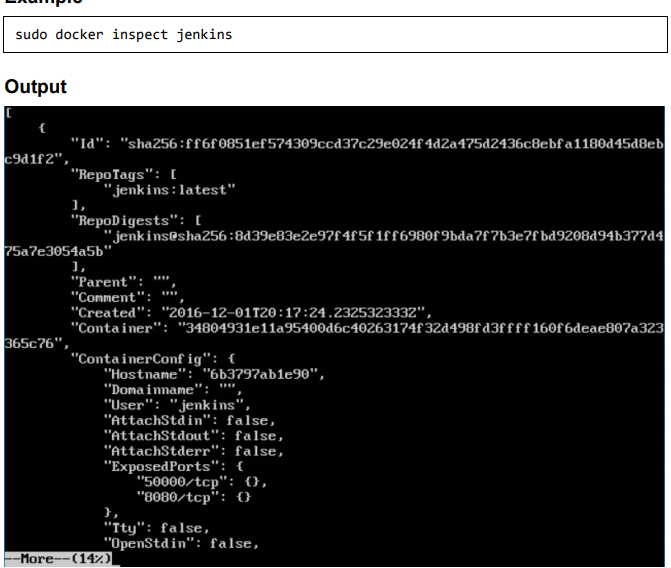
The output of the inspect command gives a JSON output. If we observe the output, we can see that there is a section of “ExposedPorts” and see that there are two ports mentioned. One is the data port of 8080 and the other is the control port of 50000.
To run Jenkins and map the ports, you need to change the Docker run command and add the ‘p’ option which specifies the port mapping.
So, you need to run the following command:
$sudo docker run -p 8080:8080 -p 50000:50000 jenkins …equation 1
Or
$ docker run -d -p 4000:8080 friendlyhello
Where,
Port No.4000 is docker local port and
Port No.8080 is docker container’s port
Friendlyhello is application name
The left-hand side of the port number mapping is the Docker host port to map to and the right-hand side is the Docker container port number.
So that we can access our app through http://localhost:4000
Because we have exported the containers port no.(80) and binds that container’s port no.80 is binds with local port no.4000 that’s why we can access the application through local port.
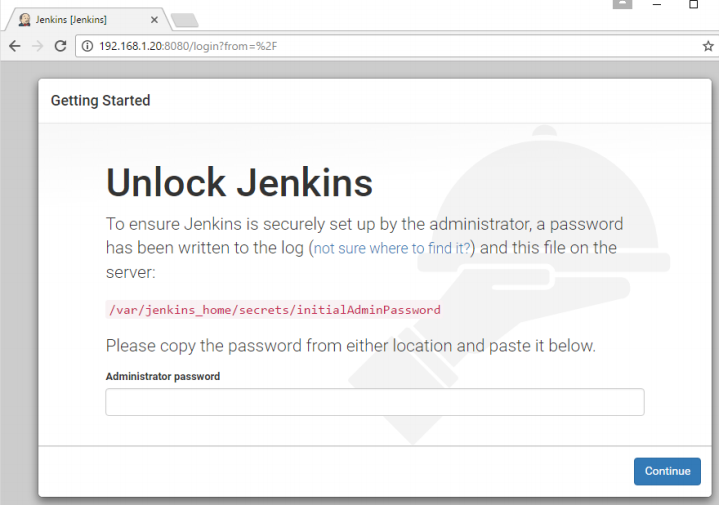
With equation 1, When you open the browser and navigate to the Docker host on port 8080, you will see Jenkins up and running.
Docker – Private Registries:
You might have the need to have your own private repositories. You may not want to host the repositories on Docker Hub. For this, there is a repository container itself from Docker. Let’s see how we can download and use the container for registry.
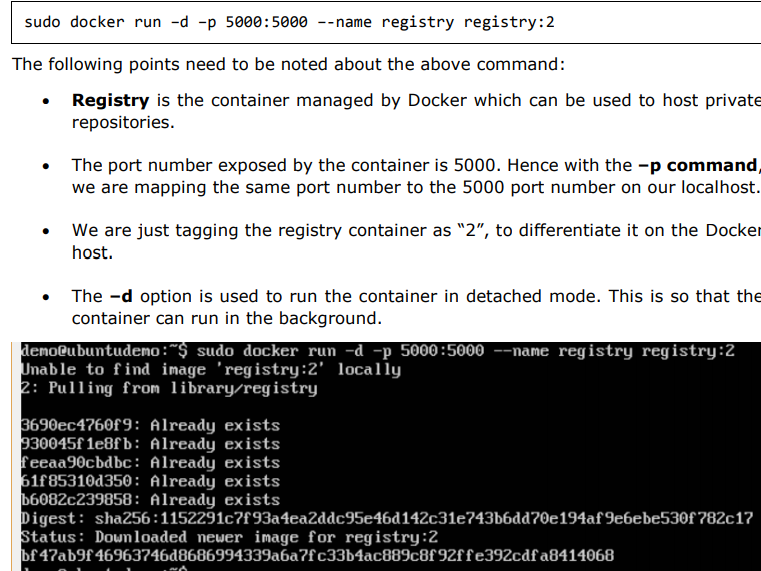
Step 1:Use the Docker run command to download the private registry. This can be done using the following command:
Step 2: Let’s do a docker ps to see that the registry container is indeed running.
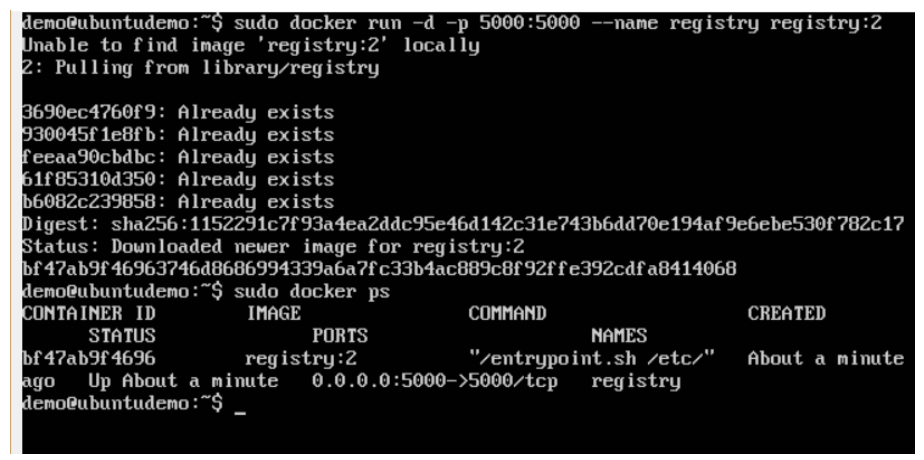
We have now confirmed that the registry container is indeed running. Step
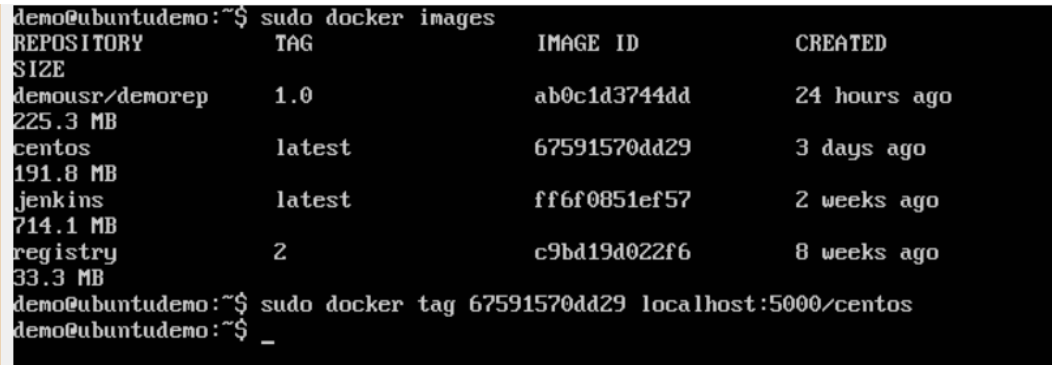
Step 3: Now let’s tag one of our existing images so that we can push it to our local repository.
In our example, since we have the centos image available locally, we are going to tag it to our private repository and add a tag name of centos.
$sudo docker tag 67591570dd29 localhost:5000/centos
The following points need to be noted about the above command: · 67591570dd29 refers to the Image ID for the centos image.
- localhost:5000 is the location of our private repository.
- We are tagging the repository name as centos in our private repository.
Step 4: Now let’s use the Docker push command to push the repository to our private repository.
$sudo docker push localhost:5000/centos
Here, we are pushing the centos image to the private repository hosted at localhost:5000.
Step 5: Now let’s delete the local images we have for centos using the docker rmi commands. We can then download the required centos image from our private repository.
$sudo docker rmi centos:latest
$sudo docker rmi 67591570dd29
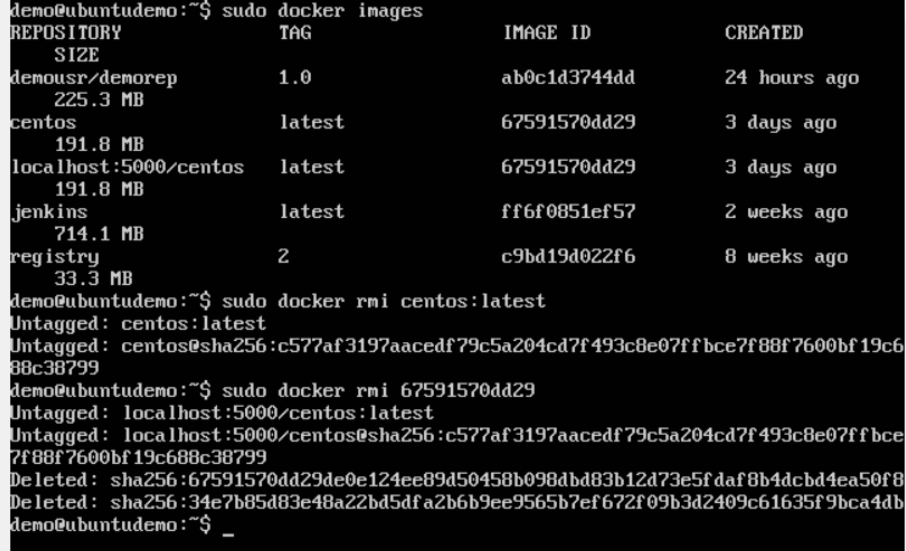
Step 6: Now that we don’t have any centos images on our local machine, we can now use the following Docker pull command to pull the centos image from our private repository.
$sudo docker pull localhost:5000/centos
Here, we are pulling the centos image to the private repository hosted at localhost:5000.
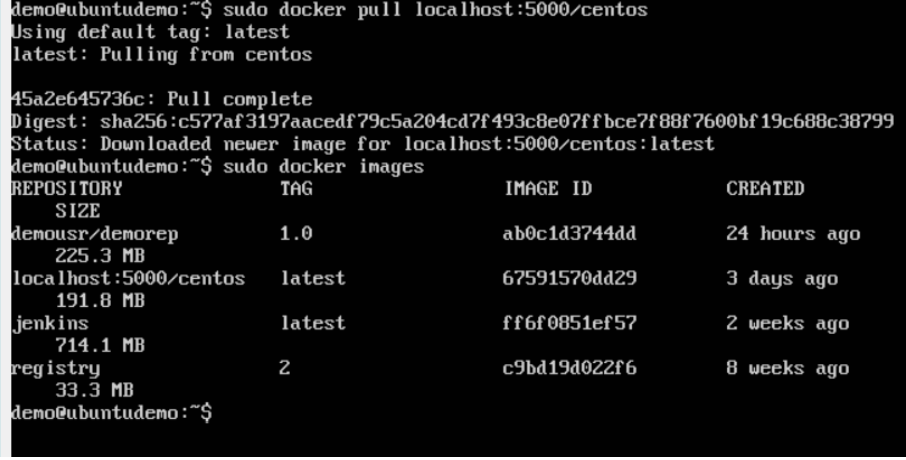
If you now see the images on your system, you will see the centos image as well.
Docker – Building a Web Server Docker File
We have already learnt how to use Docker File to build our own custom images. Now let’s see how we can build a web server image which can be used to build containers. In our example, we are going to use the Apache Web Server on Ubuntu to build our image. Let’s follow the steps given below, to build our web server Docker file.
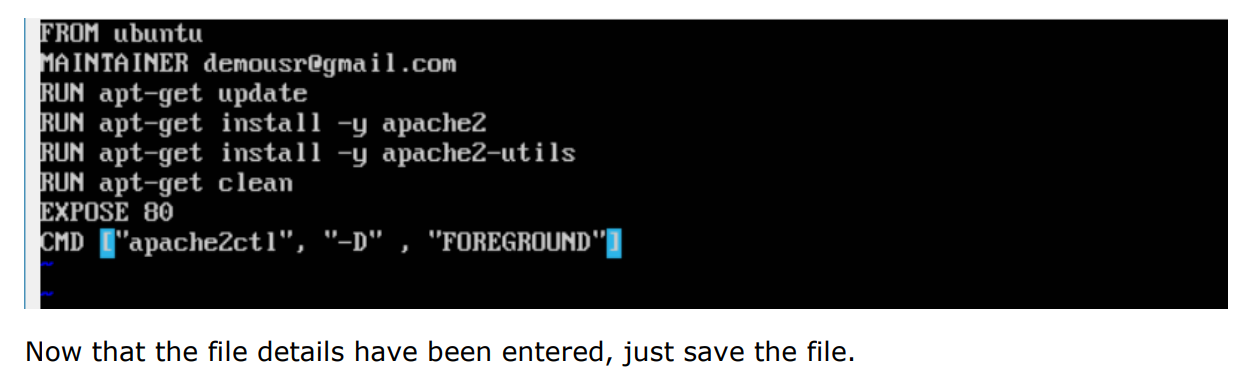
Step 1: The first step is to build our Docker File. Let’s use vim and create a Docker File with the following information.
Put following content to newly created Dockerfile.—–>
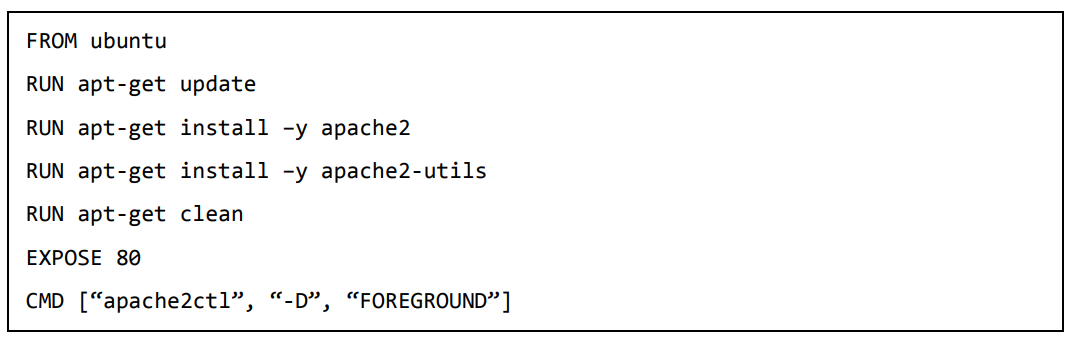
The following points need to be noted about the above statements:
- We are first creating our image to be from the Ubuntu base image. ·
- Next, we are going to use the RUN command to update all the packages on the Ubuntu system. ·
- Next, we use the RUN command to install apache2 on our image. · Next, we use the RUN command to install the necessary utility apache2 packages on our image. ·
- Next, we use the RUN command to clean any unnecessary files from the system.
- The EXPOSE command is used to expose port 80 of Apache in the container to the Docker host. ·
- Finally, the CMD command is used to run apache2 in the background.
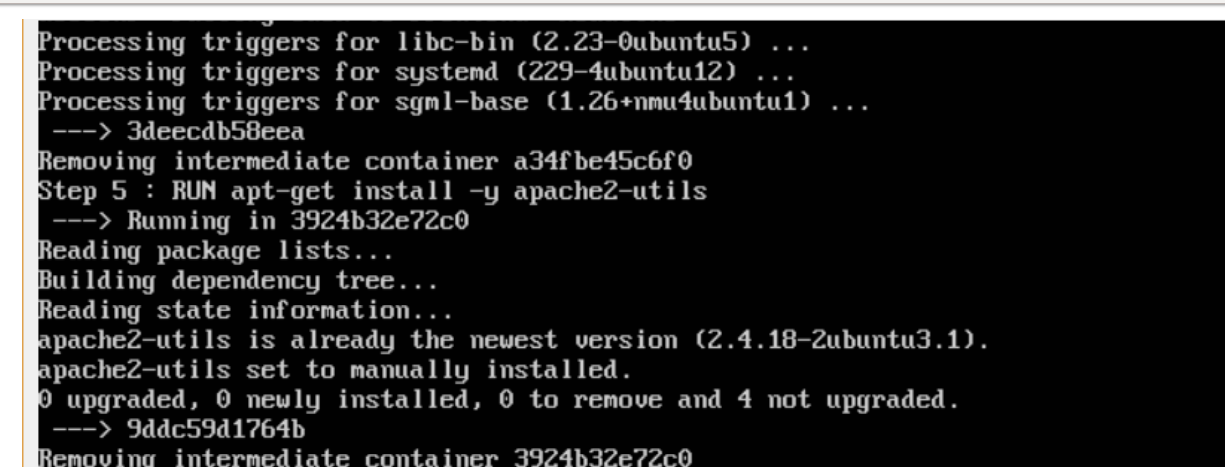
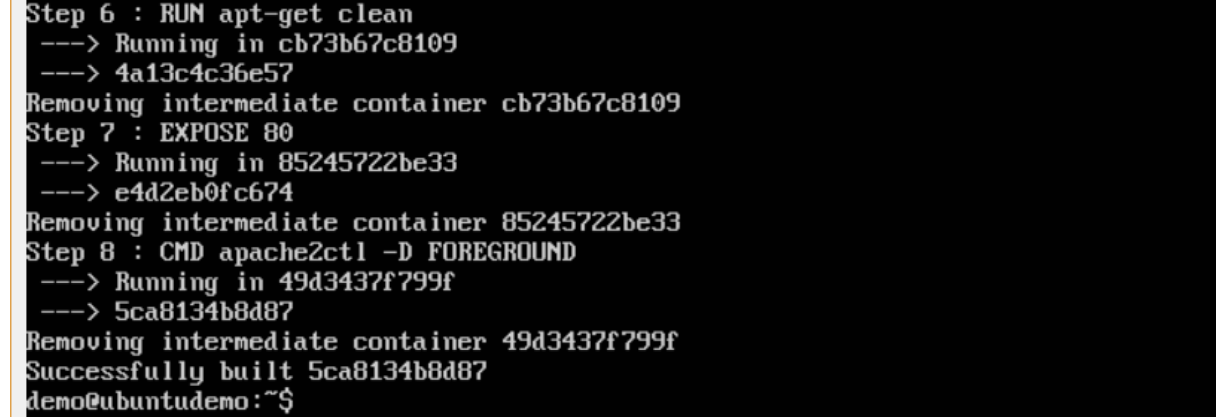
Step 2: Run the Docker build command to build the Docker file. It can be done using the following command:
$sudo docker build –t=”mywebserver” .
We are tagging our image as mywebserver. Once the image is built, you will get a successful message that the file has been built.
Step 3: Now that the web server file has been built, it’s now time to create a container from the image. We can do this with the Docker run command.
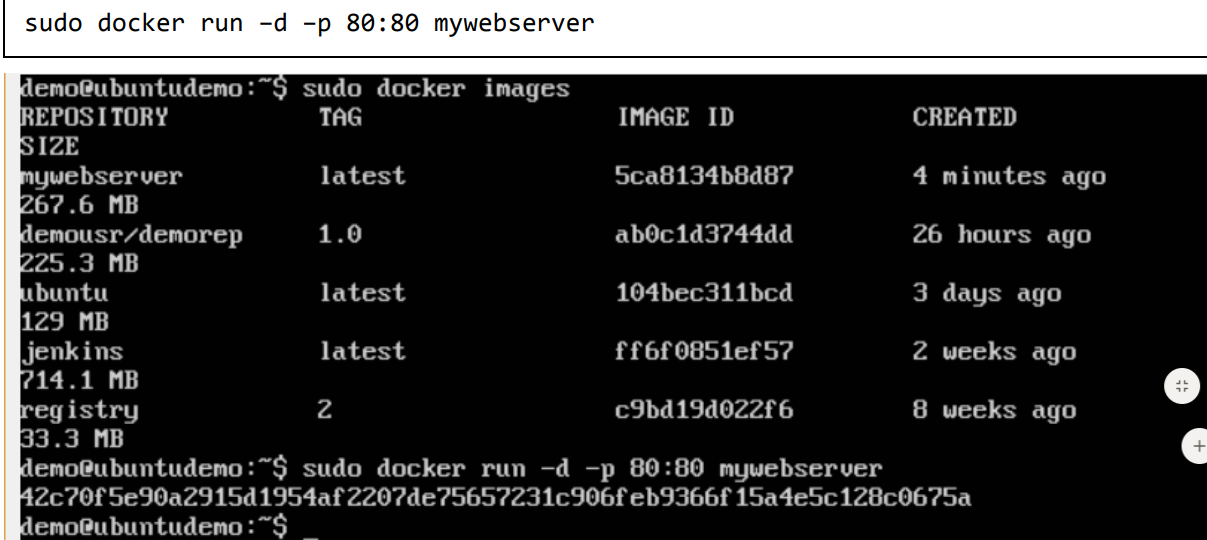
The following points need to be noted about the above command: ·
- The port number exposed by the container is 80. Hence with the –p command, we are mapping the same port number to the 80 port number on our localhost. ·
- The –d option is used to run the container in detached mode. This is so that the container can run in the background.
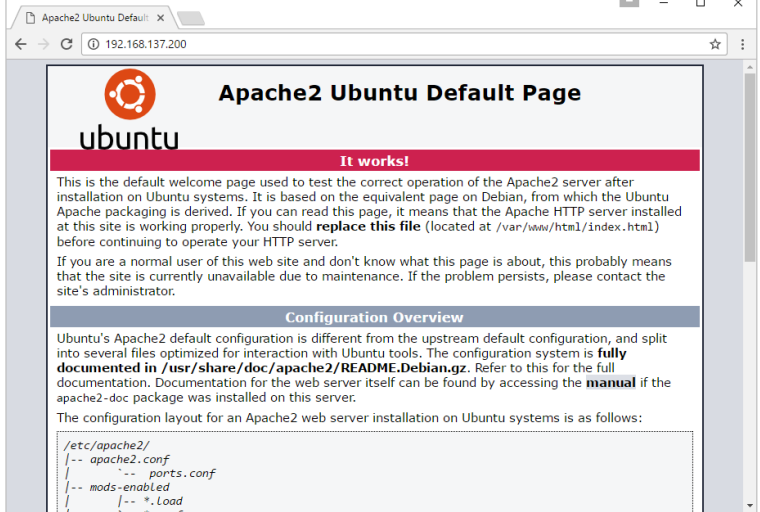
If you go to port 80 of the Docker host in your web browser, you will now see that Apache is up and running.
Docker Instruction commands:
WORKDIR command:
In docker file we can use ‘WORKDIR’command used to set the working directory of the container.
WORKDIR dirname …….Should specify in Docker file
Where,
dirname – The new working directory. If the directory does not exist, it will be added.
Docker Container Linking:
Container Linking allows multiple containers to link with each other. It is a better option than exposing ports. Let’s go step by step and learn how it works.
Step 1: Download the Jenkins image, if it is not already present, using the Jenkins pull command.
$ sudo docker jenkins pull
Step 2: Once the image is available, run the container, but this time, you can specify a name to the container by using the –-name option. This will be our source container.
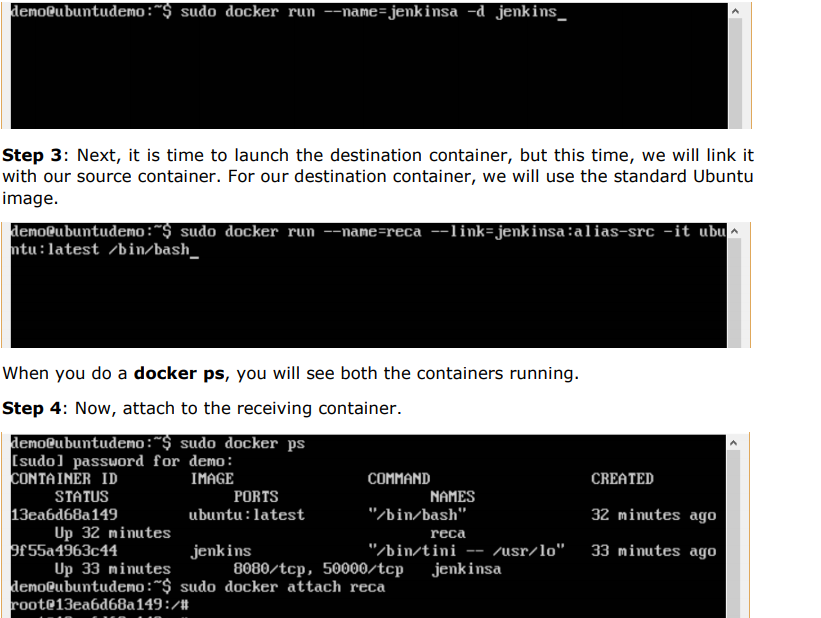
Creating a Docker Volume using Command:
$docker volume create –name=volumename –opt options
For Example:
$ sudo docker volume create –name=demo -opt o=size=100m

Listing All Docker Volumes: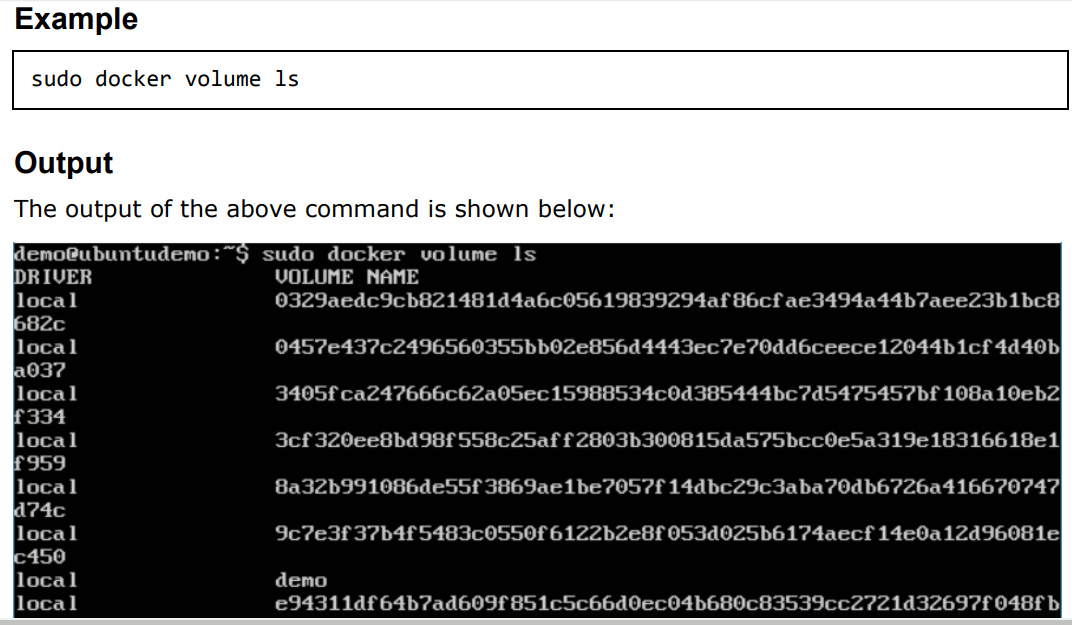
Docker Networking:
Docker takes care of the networking aspects so that the containers can communicate with other containers and also with the Docker Host. If you do an ifconfig on the Docker Host, you will see the Docker Ethernet adapter. This adapter is created when Docker is installed on the Docker Host.
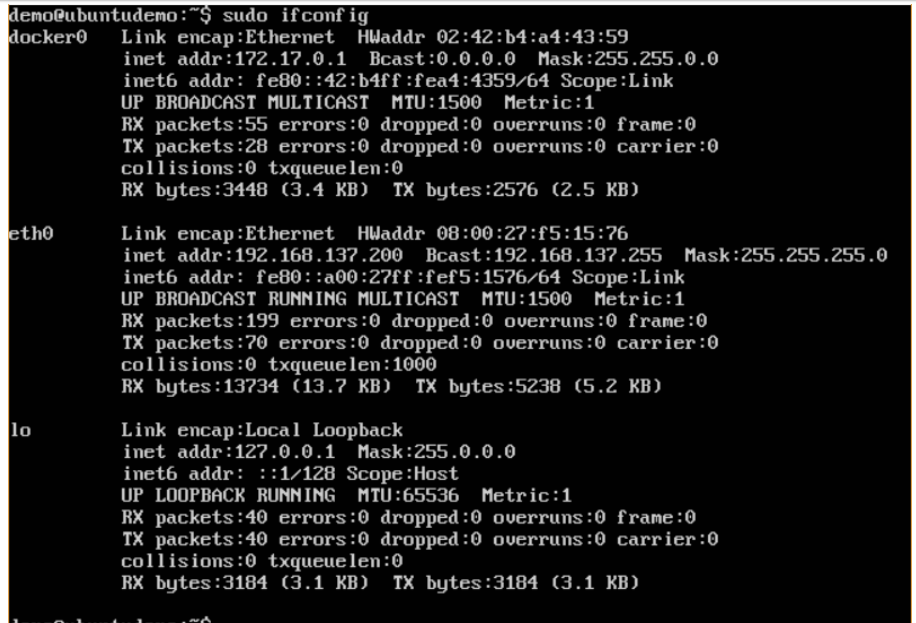
This is a bridge between the Docker Host and the Linux Host. Now let’s look at some commands associated with networking in Docker.
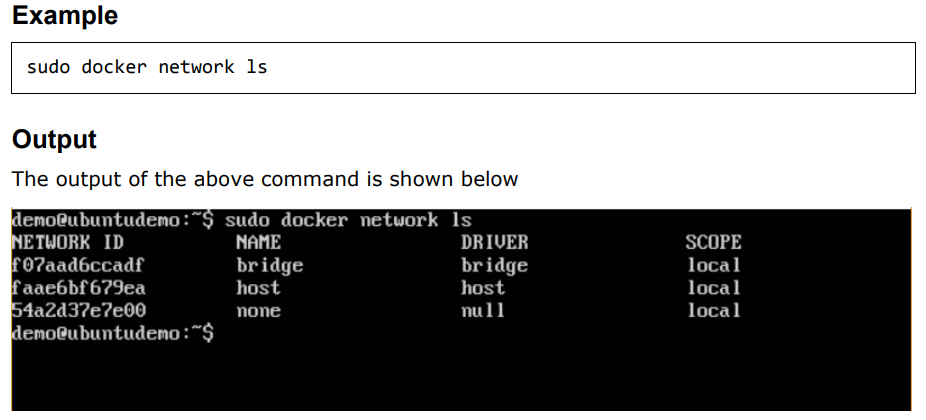
Listing All Docker Networks:
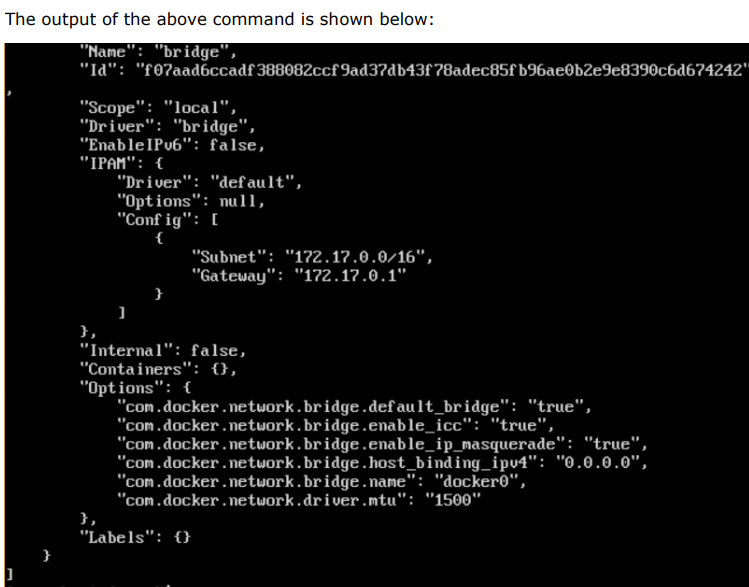
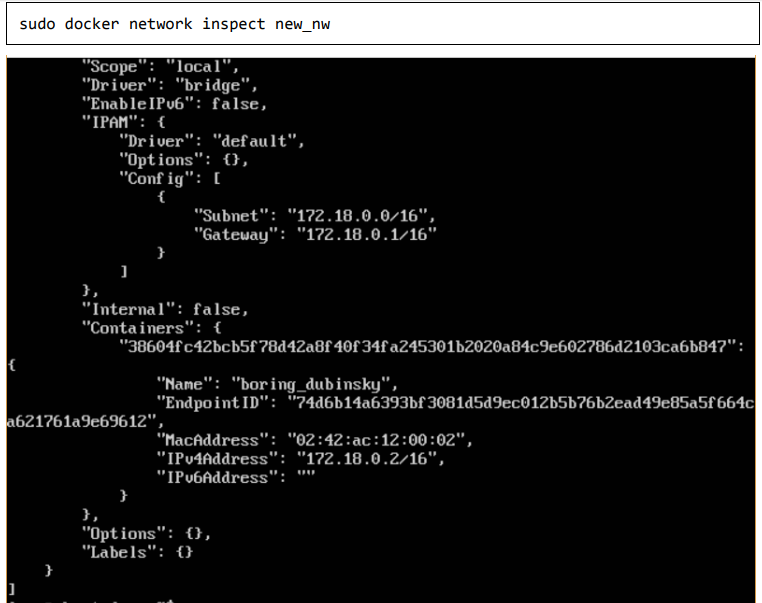
Inspecting a Dockernetwork:
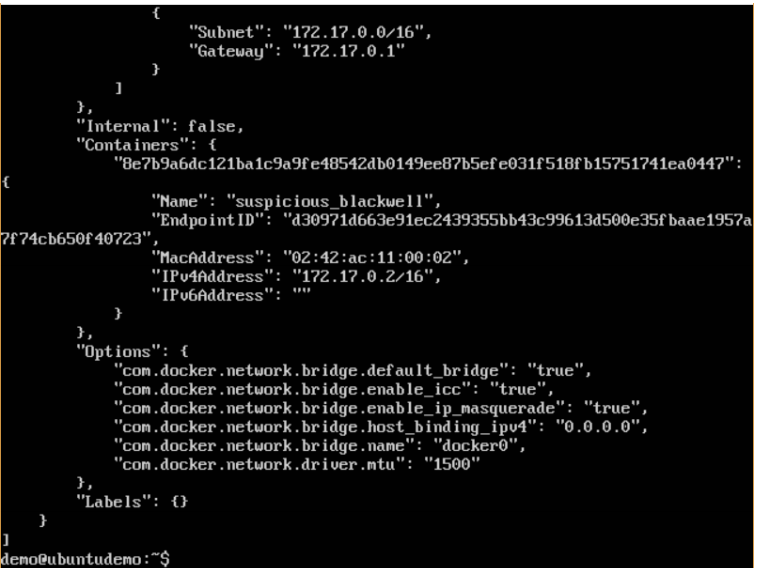
If you want to see more details on the network associated with Docker, you can use the Docker network inspect command.
$sudo docker network inspect bridge
Where,
‘bridge‘ is ur network name.
OutPut:
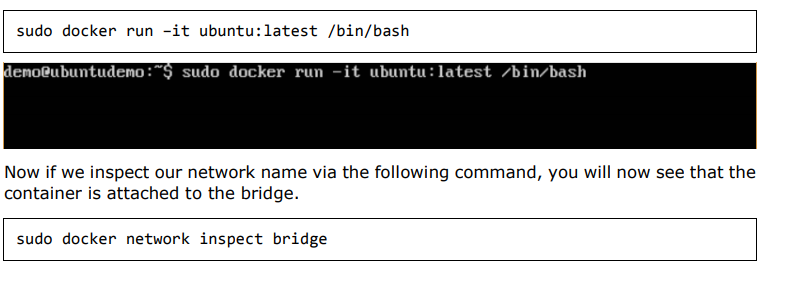
Now let’s run a container and see what happens when we inspect the network again. Let’s spin up an Ubuntu container with the following command:
$sudo docker run –it ubuntu:latest /bin/bash
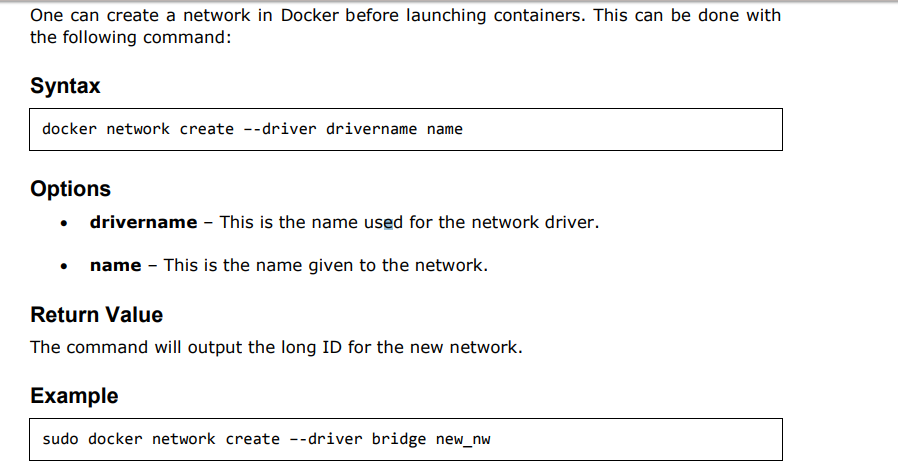
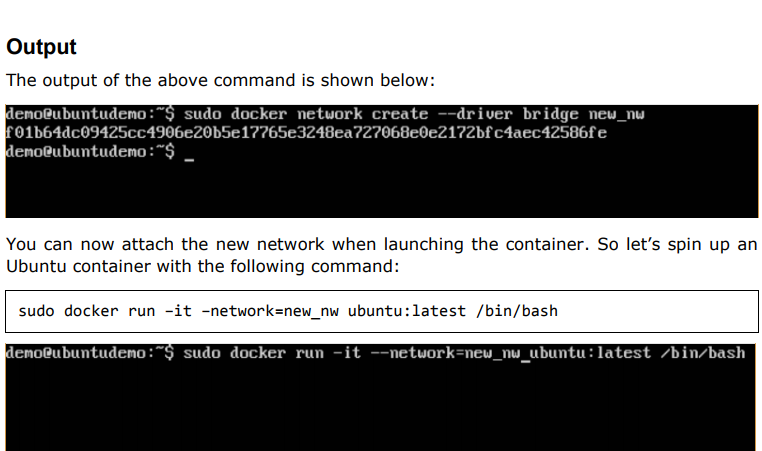
Creating Your Own New Network in Docker:
And now when you inspect the network via the following command, you will see the container attached to the network.
EXCERCISE:
1.Docker – Setting Node.js Application:
Node.js is a JavaScript framework that is used for developing server-side applications. It is an open source framework that is developed to run on a variety of operating systems.
Since Node.js is a popular framework for development, Docker has also ensured it has support for Node.js applications.
We will now see the various steps for getting the Docker container for Node.js up and running.
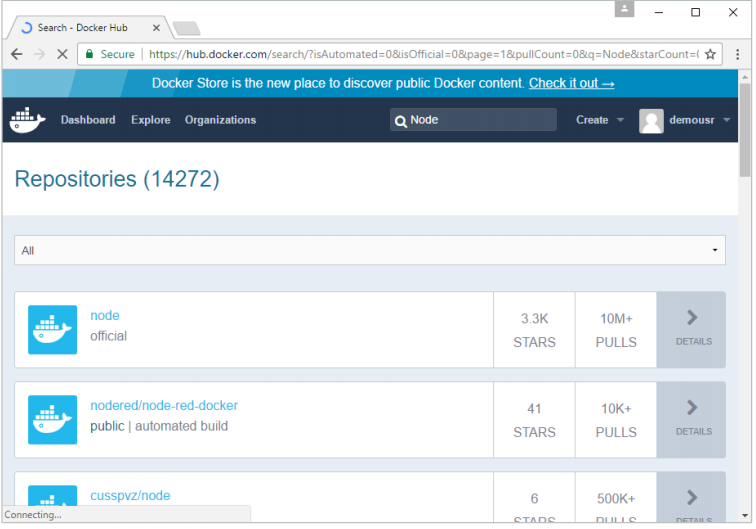
Step 1: The first step is to pull the image from Docker Hub. When you log into Docker Hub, you will be able to search and see the image for Node.js as shown below. Just type in Node in the search box and click on the node (official) link which comes up in the search results.
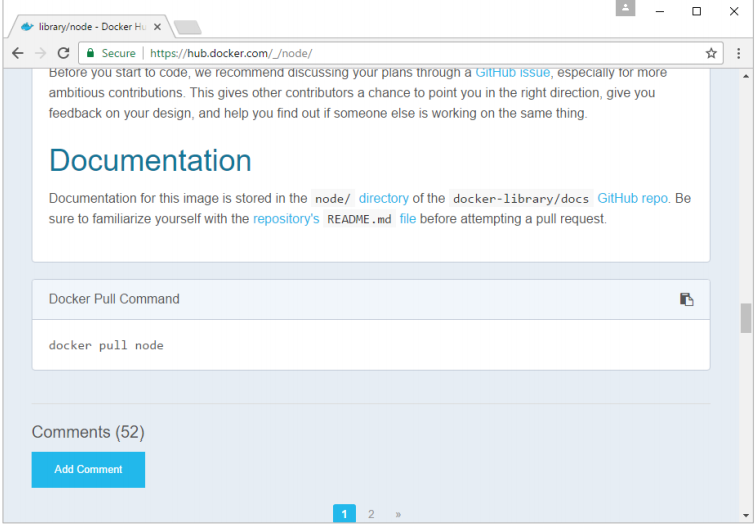
Step 2: You will see that the Docker pull command for node in the details of the repository in Docker Hub.
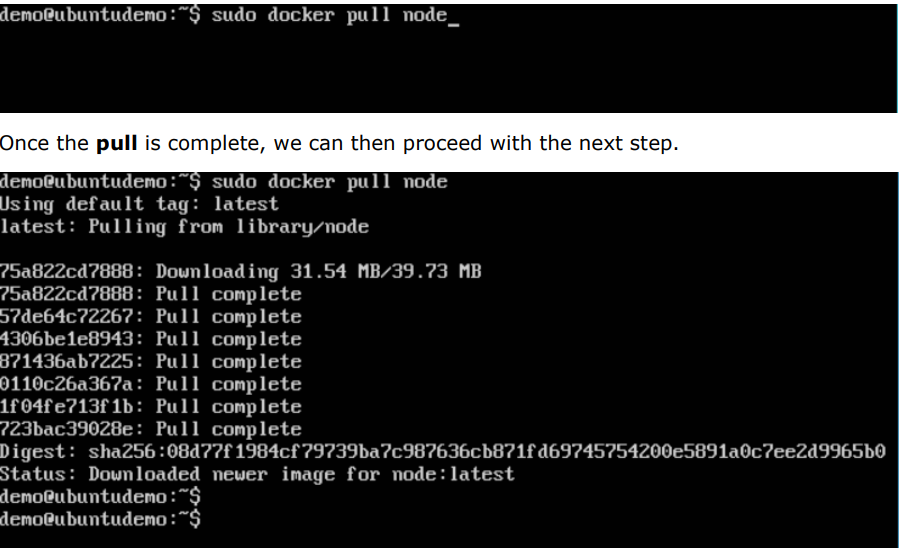
Step 3: On the Docker Host, use the Docker pull command as shown above to download the latest node image from Docker Hub.
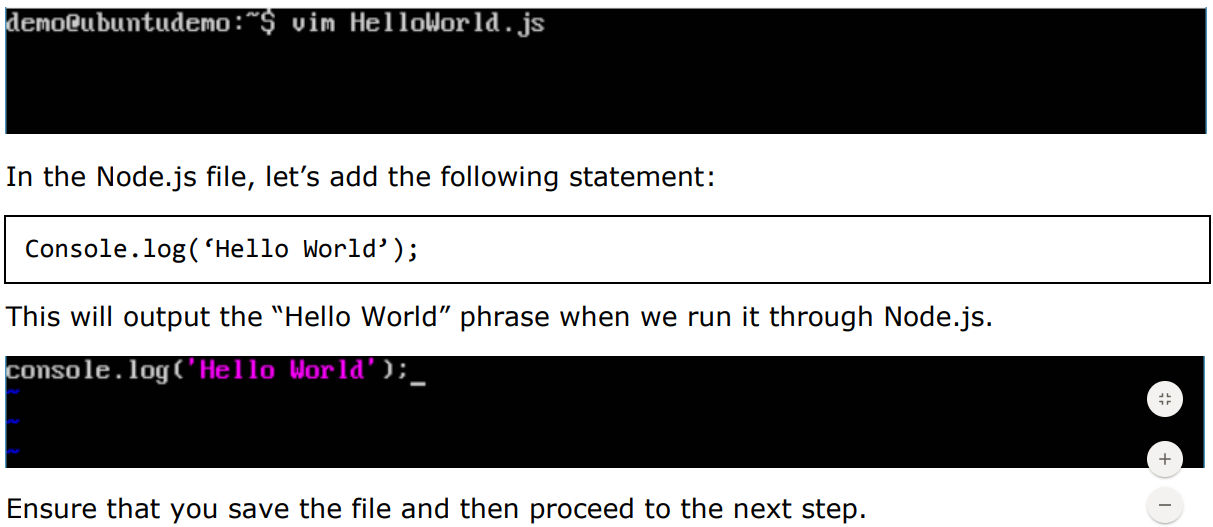
Step 4: On the Docker Host, let’s use the vim editor and create one Node.js example file.
In this file, we will add a simple command to display “HelloWorld” to the command prompt.
Step 5: To run our Node.js script using the Node Docker container, we need to execute the following statement:
demo@ubuntudemo: $ cd /usr/src/
demo@ubuntudemo src:$ mkdir app
demo@ubuntudemo:$ cd app
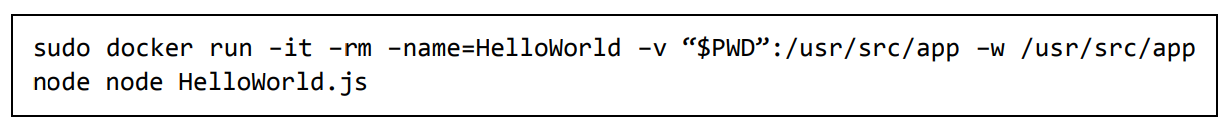
demo@ubuntudemo app: $ sudo docker run -it -rm -name=HelloWorld -v “$PWD”:/usr/src/app -w /usr/src/app node node HelloWorld.js
Or
- The following points need to be noted about the above command:
- The –rm option is used to remove the container after it is run. ·
- We are giving a name to the container called “HelloWorld” ·
- We are mentioning to map the volume in the container which is /usr/src/app to our current present working directory. This is done so that the node container will pick up our HelloWorld.js script which is present in our working directory on the Docker Host. ·
- The –w option is used to specify the working directory used by Node.js. ·
- The first node option is used to specify to run the node image. ·
- The second node option is used to mention to run the node command in the node container. ·
- And finally we mention the name of our script.
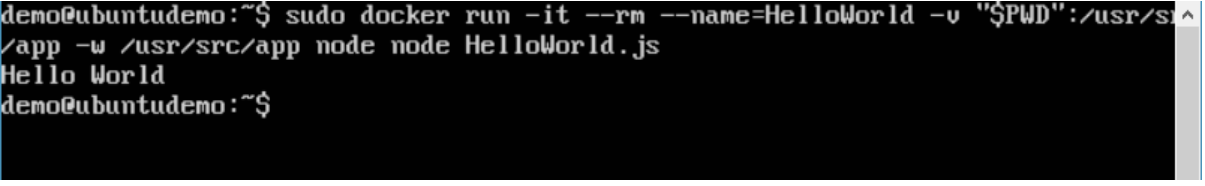
We will then get the following output. And from the output, we can clearly see that the Node container ran as a container and executed the HelloWorld.js script.
Or
demo@ubuntudemo:$ sudo docker run -it –rm –name=HelloWorld -v /usr/src/app/HelloWorld.js:/usr/src/app -w /usr/src/app node node HelloWorld.js
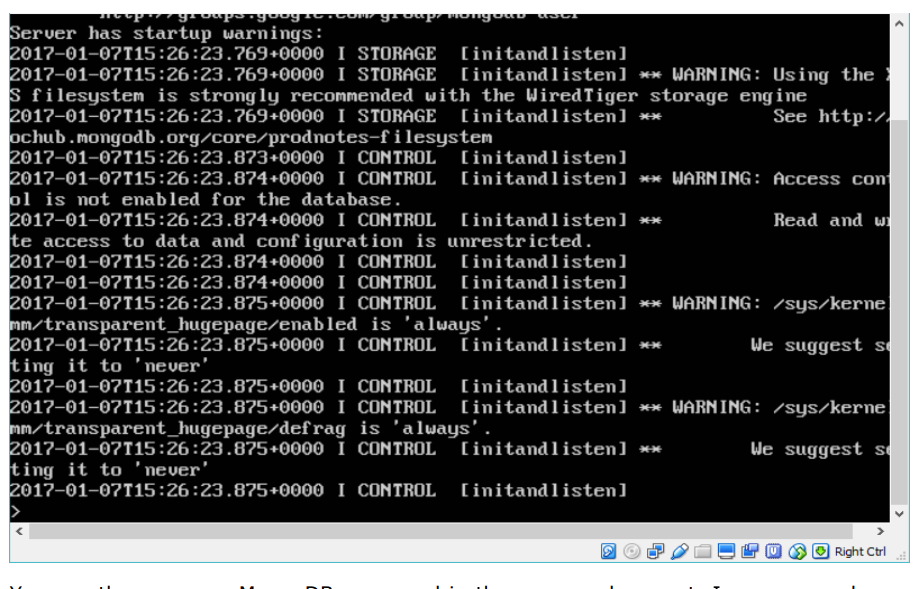
2.Docker – Setting MongoDB:
MongoDB is a famous document-oriented database that is used by many modern-day web applications.
Since MongoDB is a popular database for development, Docker has also ensured it has support for MongoDB. We will now see the various steps for getting the Docker container for MongoDB up and running.
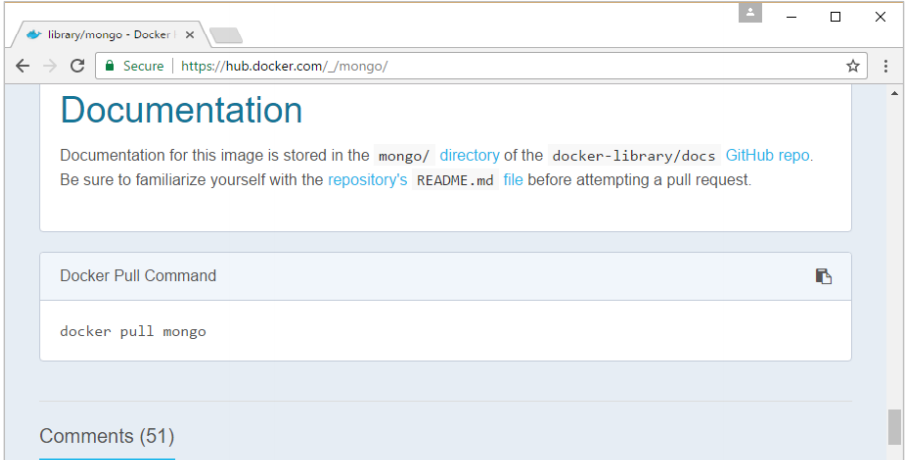
Step 1: The first step is to pull the image from Docker Hub. When you log into Docker Hub, you will be able to search and see the image for Mongo as shown below. Just type in Mongo in the search box and click on the Mongo (official) link which comes up in the search results.
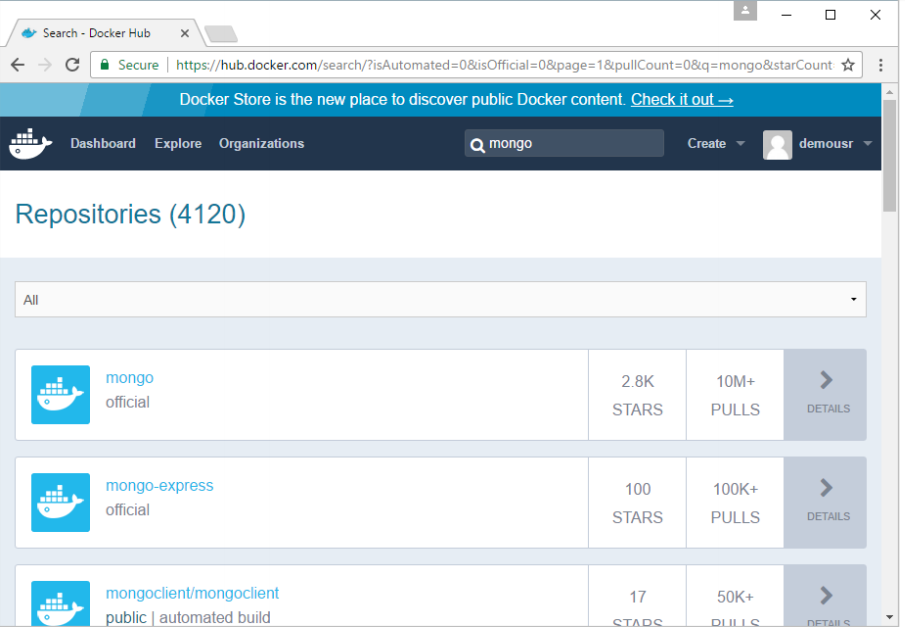
Step 2: You will see that the Docker pull command for Mongo in the details of the repository in Docker Hub.
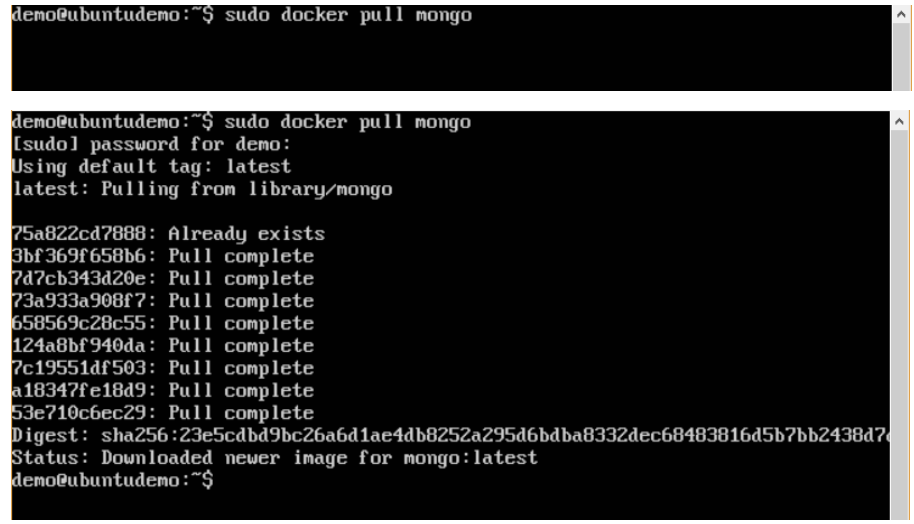
Step 3: On the Docker Host, use the Docker pull command as shown above to download the latest Mongo image from Docker Hub.
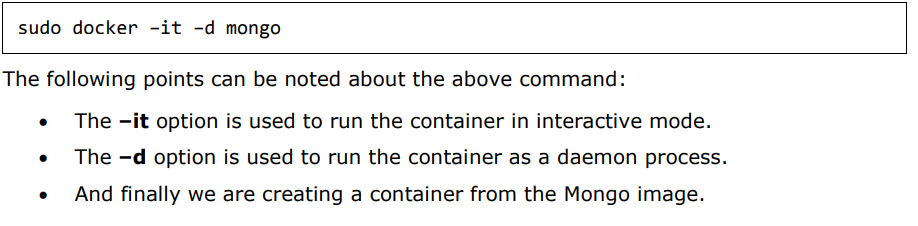
Step 4: Now that we have the image for Mongo, let’s first run a MongoDB container which will be our instance for MongoDB.
For this, we will issue the following command:
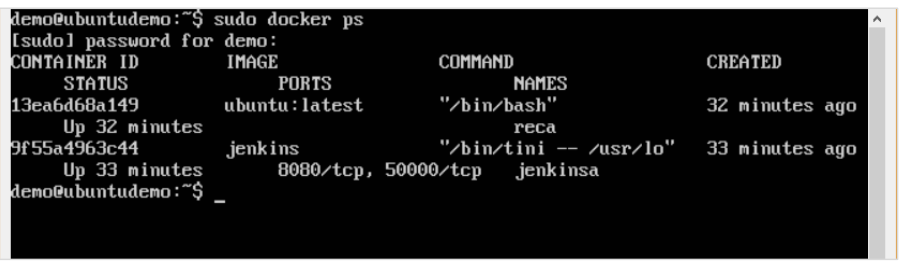
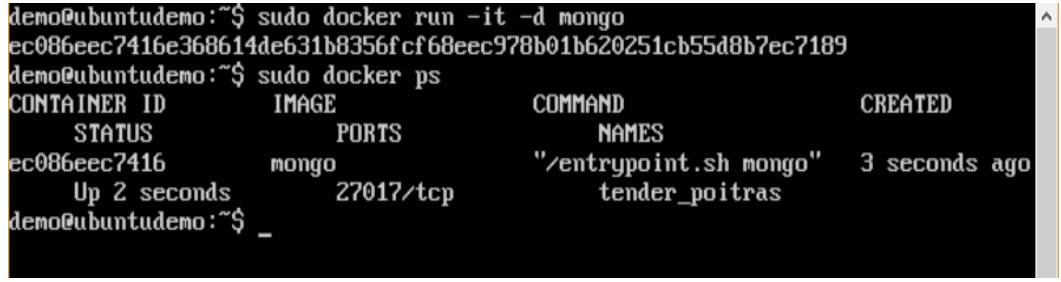
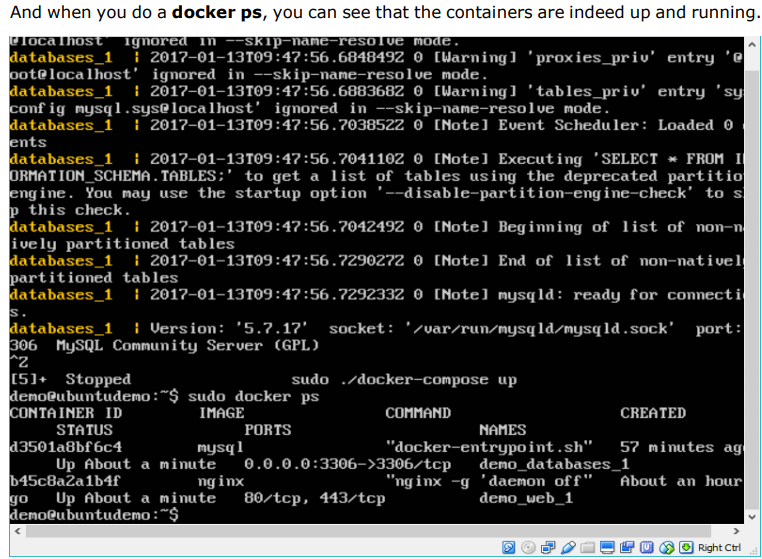
You can then issue the docker ps command to see the running containers:
Step 5: Now let’s spin up another container which will act as our client which will be used to connect to the MongoDB database. Let’s issue the following command for this:
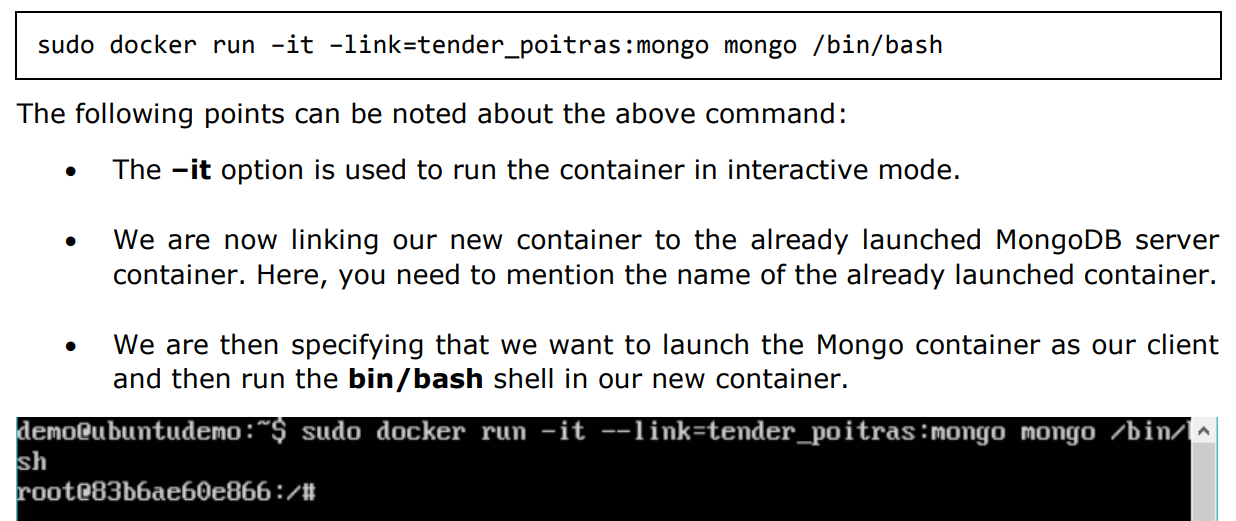
You will now be in the new container.
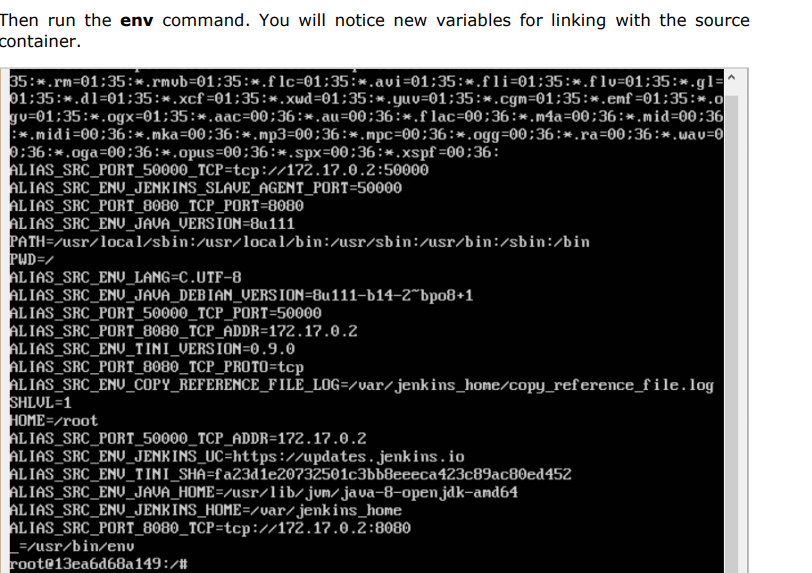
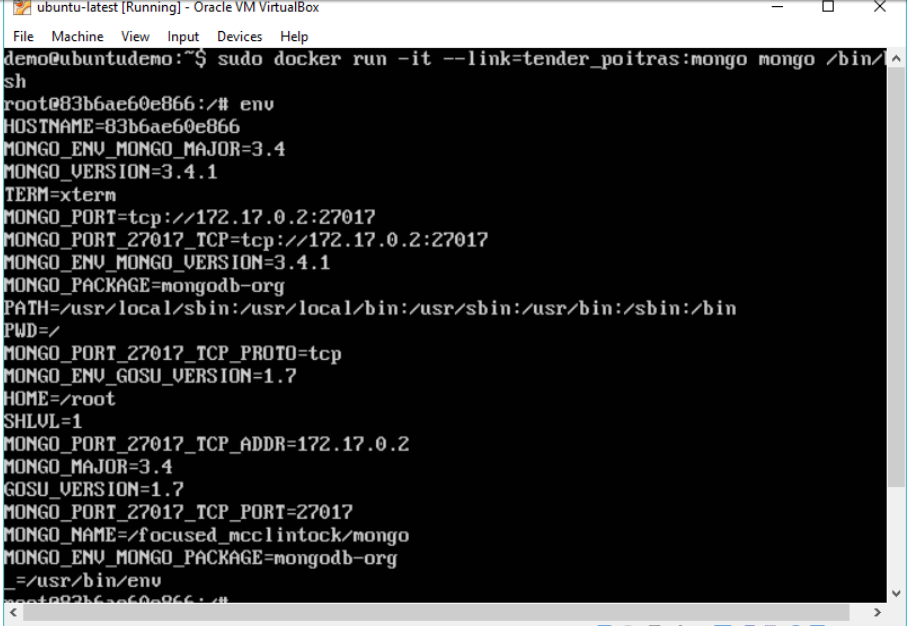
Step 6: Run the env command in the new container to see the details of how to connect to the MongoDB server container.
Step 6: Now it’s time to connect to the MongoDB server from the client container. We can do this via the following command:
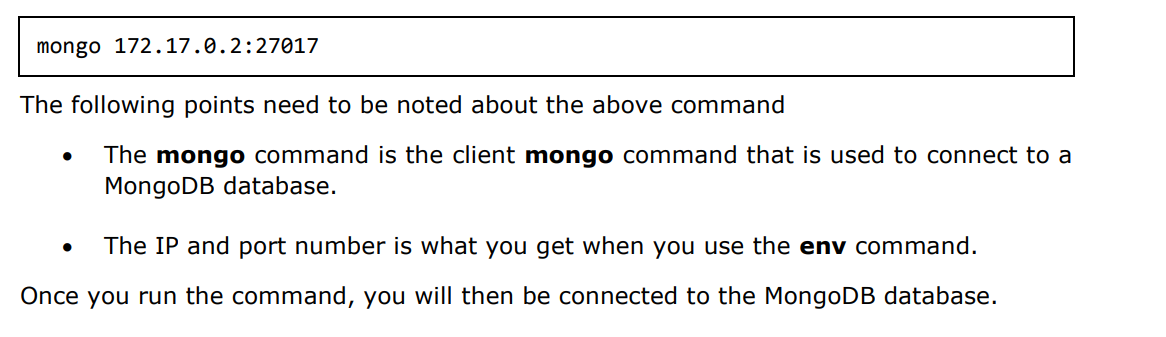
You can then run any MongoDB command in the command prompt. In our example, we are running the following command:
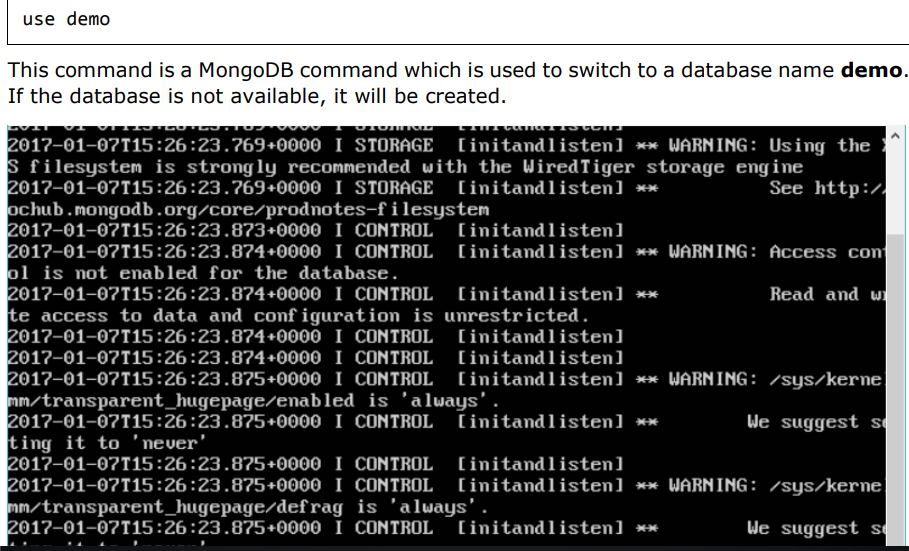
Now you have successfully created a client and server MongoDB container.
3.Docker – Setting NGINX
NGINX is a popular lightweight web application that is used for developing server-side applications. It is an open-source web server that is developed to run on a variety of operating systems.
Since nginx is a popular web server for development, Docker has ensured that it has support for nginx.
We will now see the various steps for getting the Docker container for nginx up and running.
Step 1: The first step is to pull the image from Docker Hub. When you log into Docker Hub, you will be able to search and see the image for nginx as shown below.
Just type in nginx in the search box and click on the nginx (official) link which comes up in the search results.
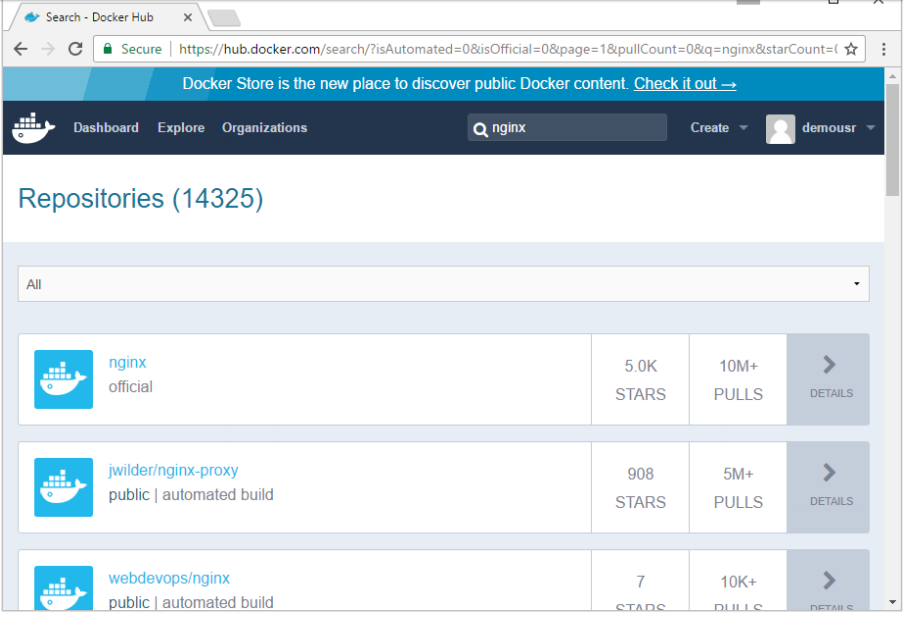
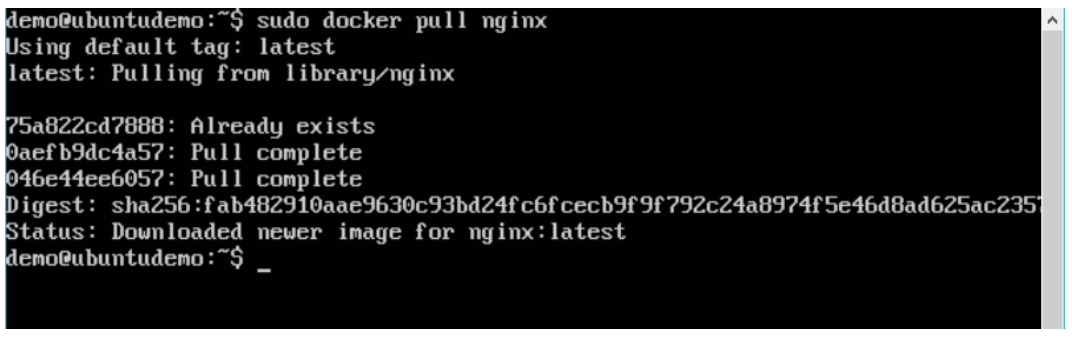
Step 2: You will see that the Docker pull command for nginx in the details of the repository in Docker Hub.
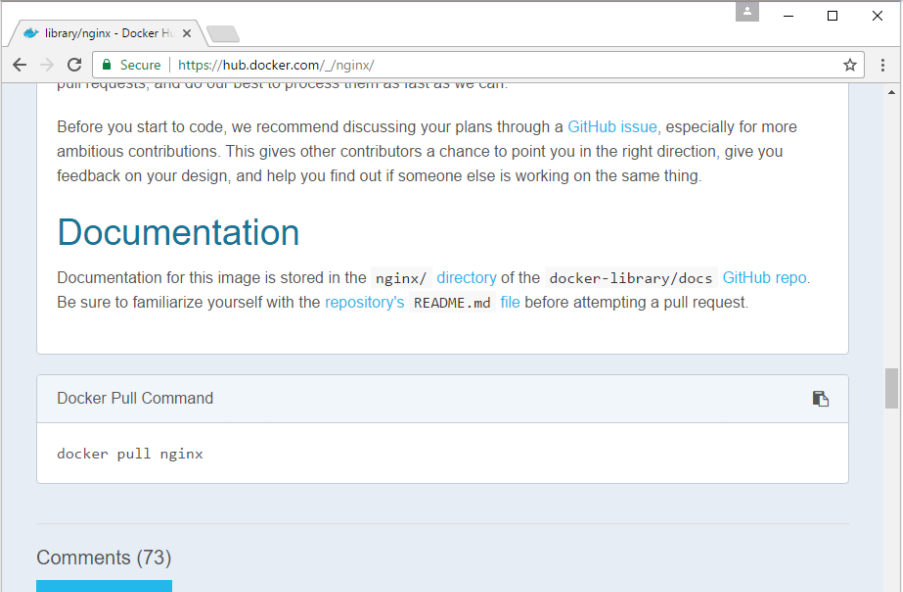
Step 3: On the Docker Host, use the Docker pull command as shown above to download the latest nginx image from Docker Hub.
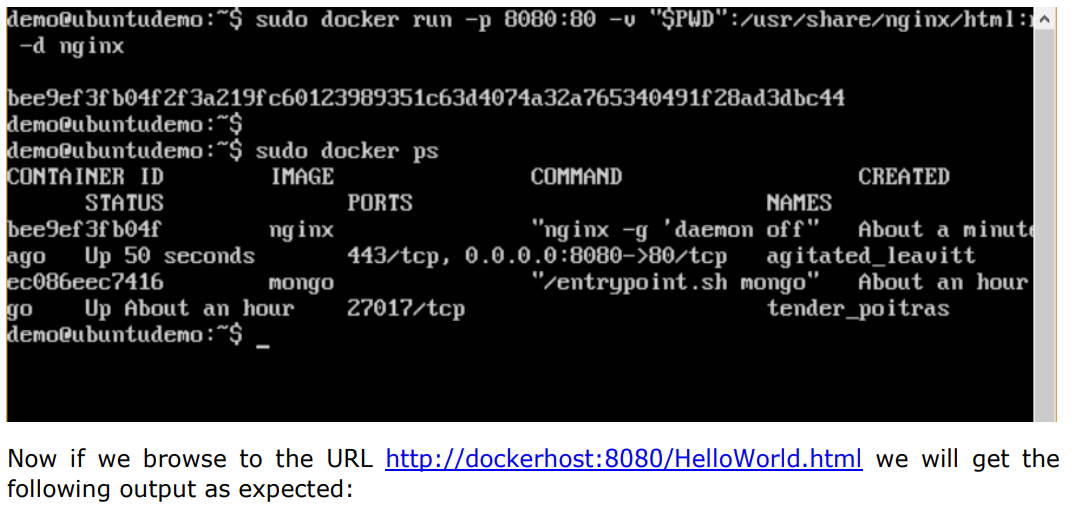
Step 4: Now let’s run the nginx container via the following command:
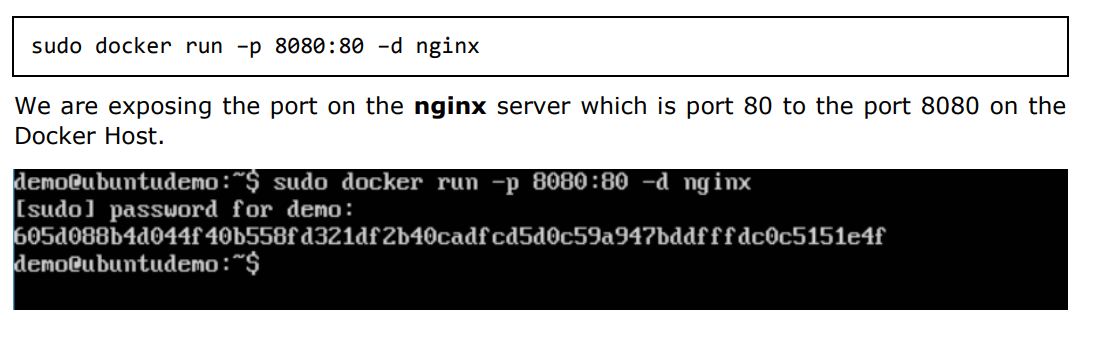
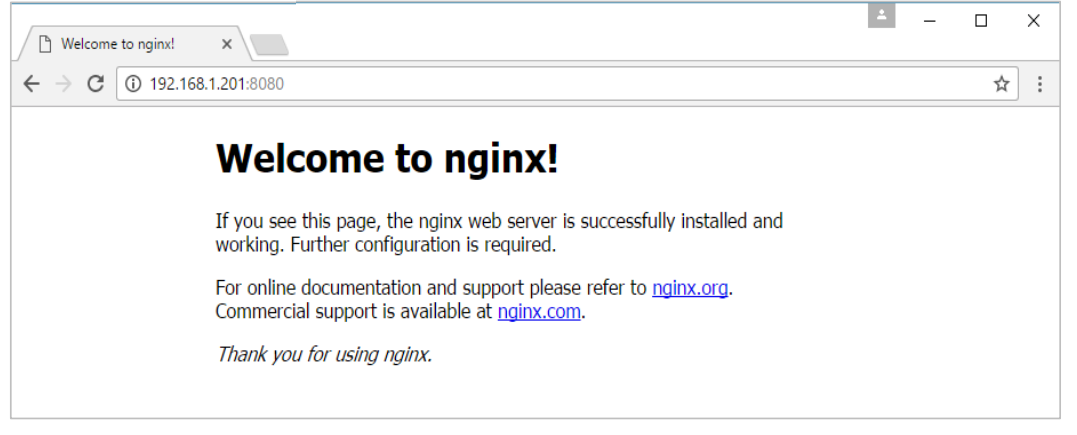
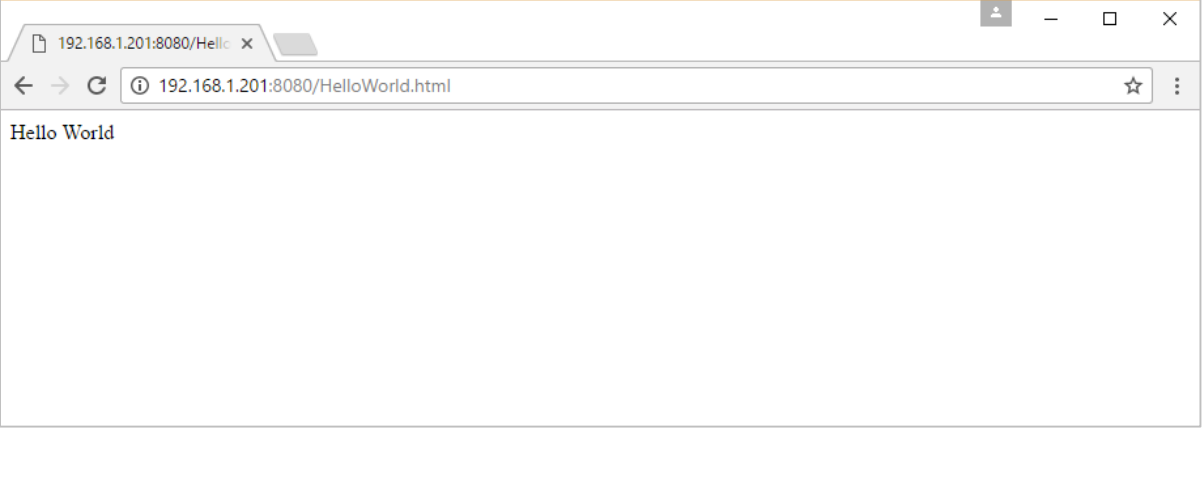
Once you run the command, you will get the following output if you browse to the URL http://dockerhost:8080. This shows that the nginx container is up and running.
Step 5: Let’s look at another example where we can host a simple web page in our ngnix container. In our example, we will create a simple HelloWorld.html file and host it in our nginx container.
Let’s first create an HTML file called HelloWorld.html
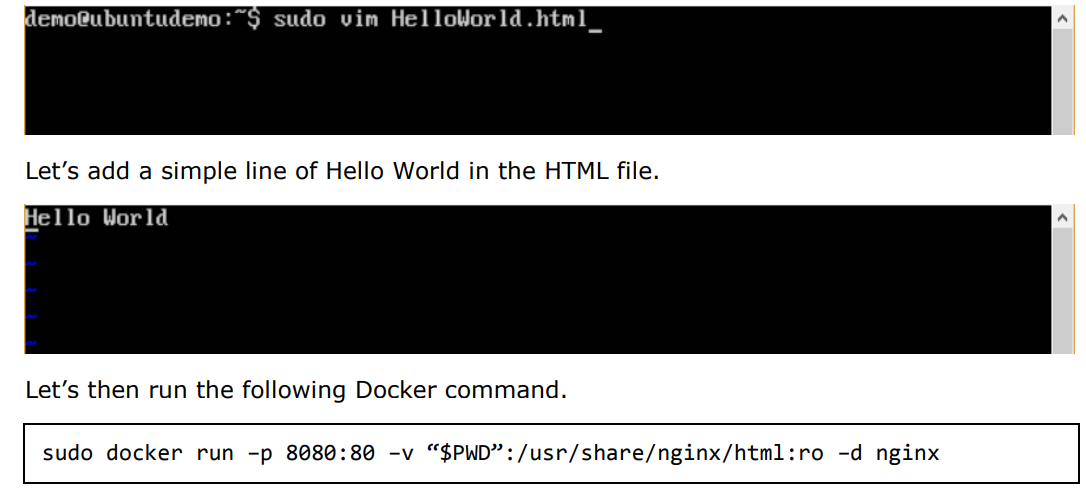
The following points need to be noted about the above command: ·
- We are exposing the port on the nginx server which is port 80 to port 8080 on the Docker Host. ·
- Next, we are attaching the volume on the container which is /usr/share/nginx/html to our present working directory. This is where our HelloWorld.html file is stored.
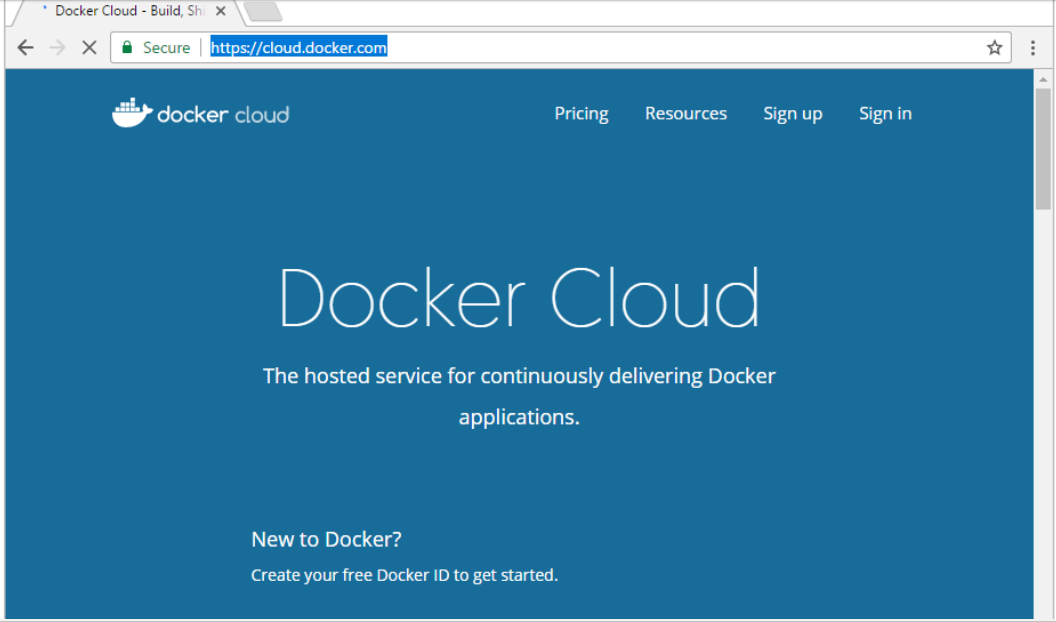
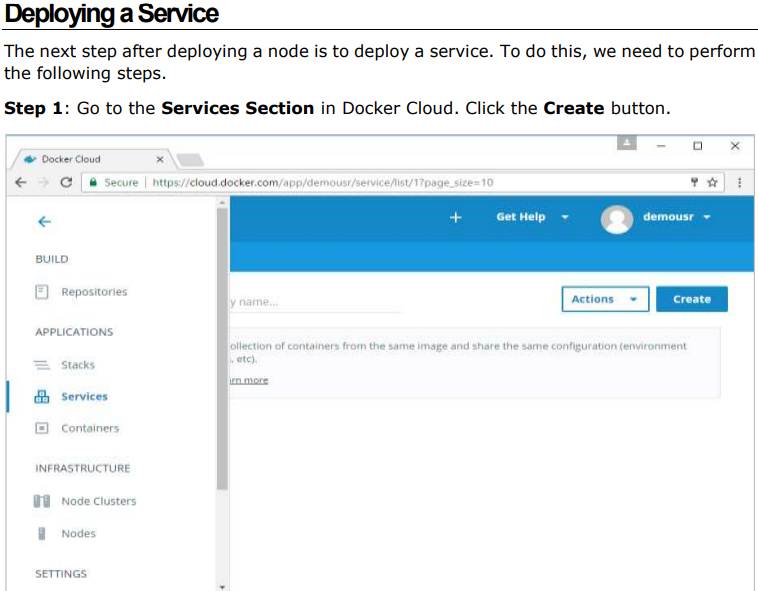
4.Docker – Docker Cloud:
The Docker Cloud is a service provided by Docker in which you can carry out the following operations:
- Nodes ─ You can connect the Docker Cloud to your existing cloud providers such as Azure and AWS to spin up containers on these environments. ·
- Cloud Repository ─ Provides a place where you can store your own repositories. ·
- Continuous Integration ─ Connect with Github and build a continuous integration pipeline. ·
- Application Deployment ─ Deploy and scale infrastructure and containers. Continuous Deployment ─ Can automate deployments.
You can go to the following link to getting started with Docker Cloud: https://cloud.docker.com/
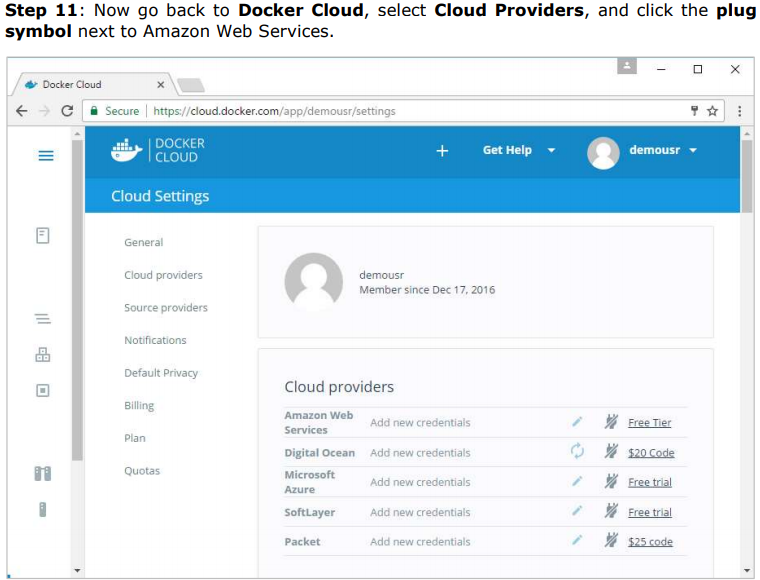
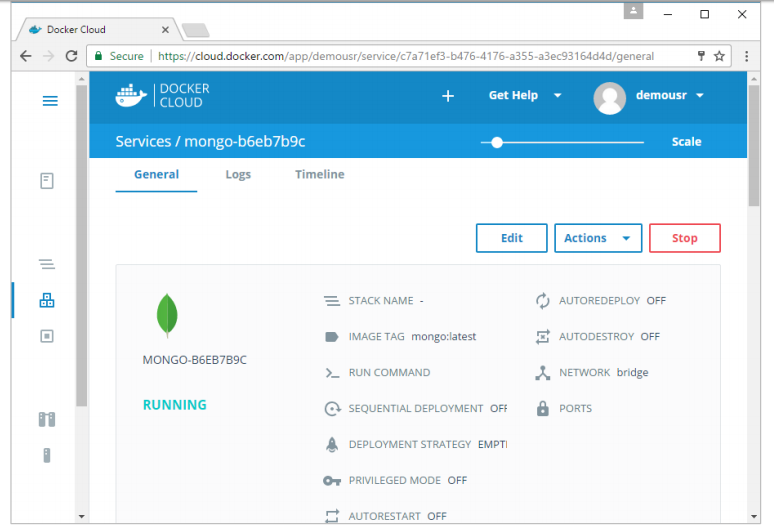
Once logged in, you will be provided with the following basic interface: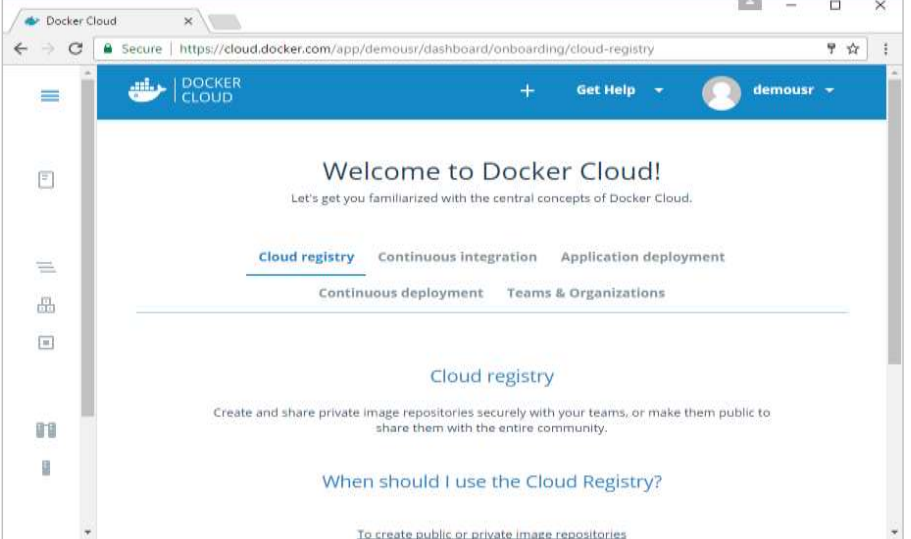
Connecting to the Cloud Provider The first step is to connect to an existing cloud provider. The following steps will show you how to connect with an Amazon Cloud provider.
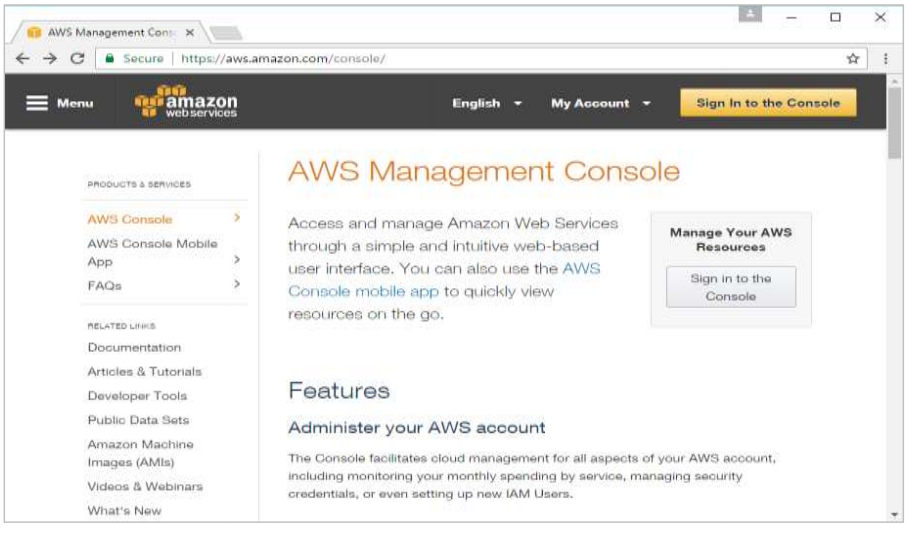
Step 1: The first step is to ensure that you have the right AWS keys. This can be taken from the aws console. Log into your aws account using the following link – https://aws.amazon.com/console/
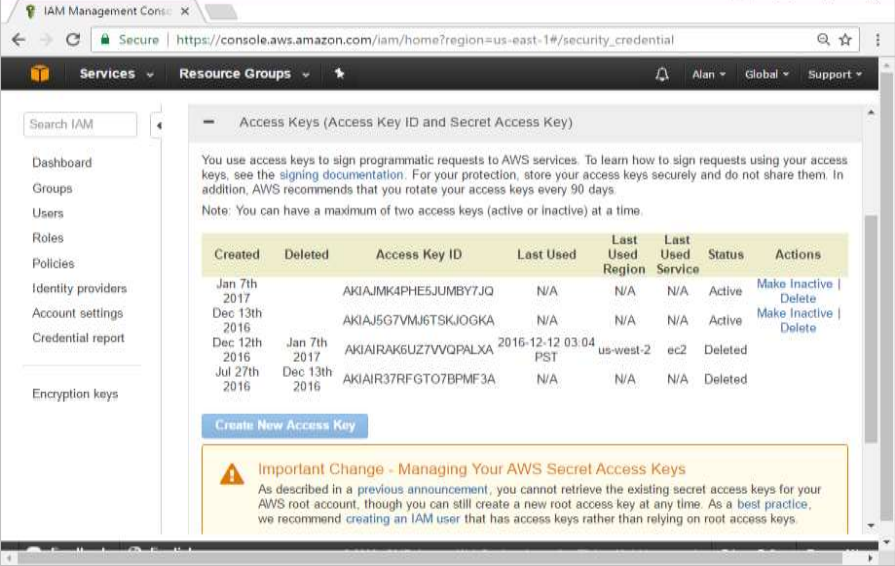
Step 2: Once logged in, go to the Security Credentials section. Make a note of the access keys which will be used from Docker Hub.
Step 3: Next, you need to create a policy in aws that will allow Docker to view EC2 instances. Go to the profiles section in aws. Click the Create Policy button.
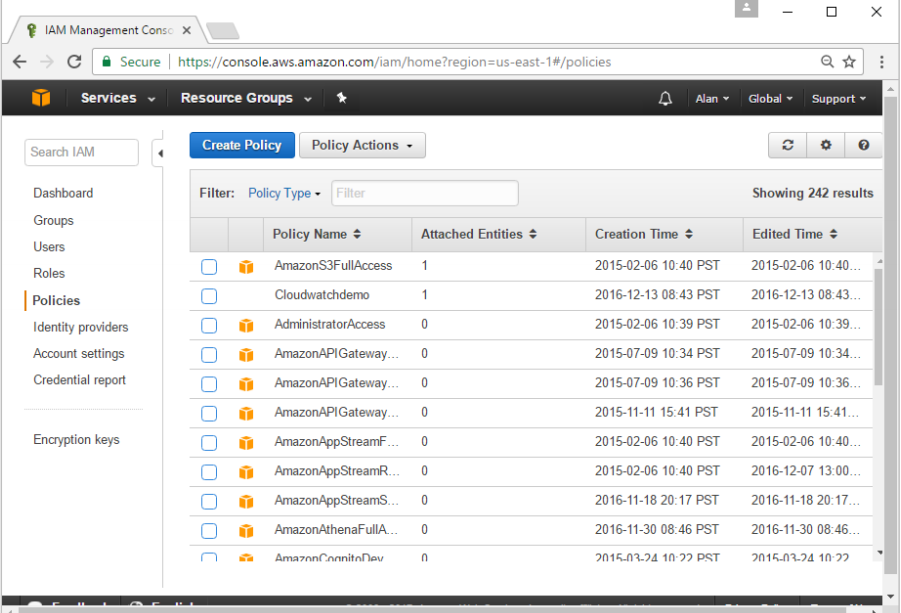
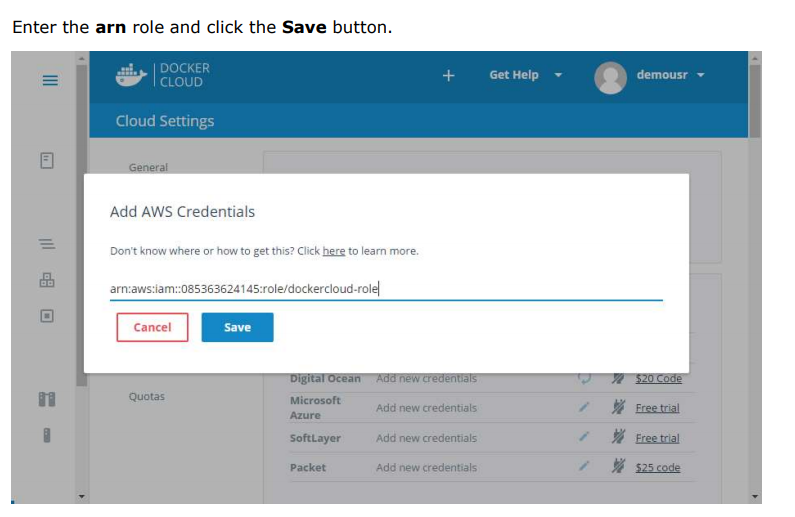
Step 4: Click on ‘Create Your Own Policy’ and give the policy name as dockercloudpolicy and the policy definition as shown below.
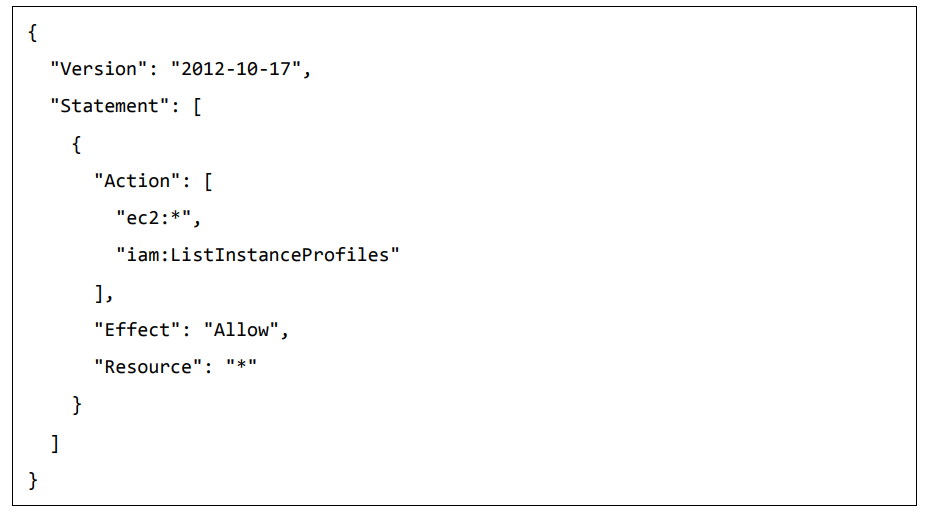
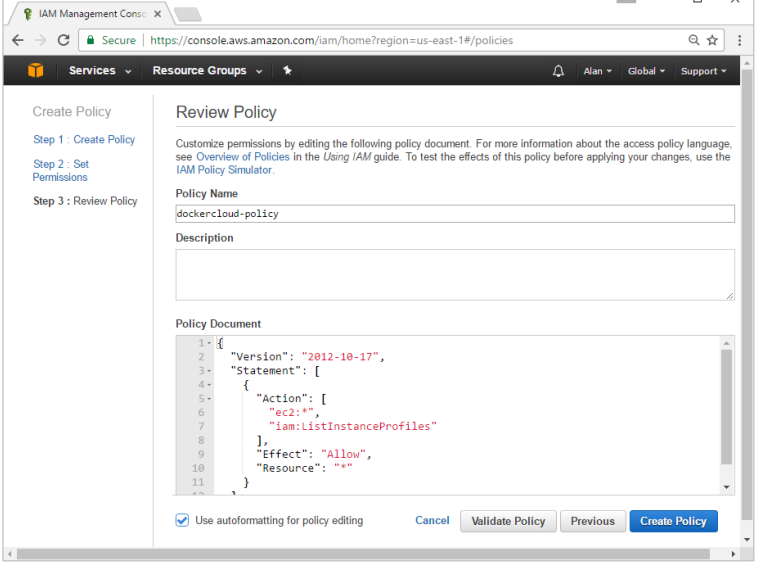
Next, click the Create Policy button.
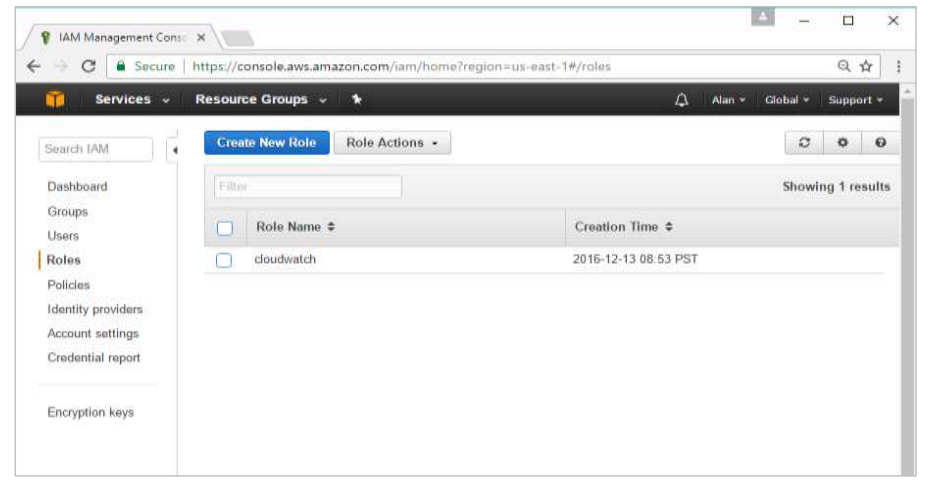
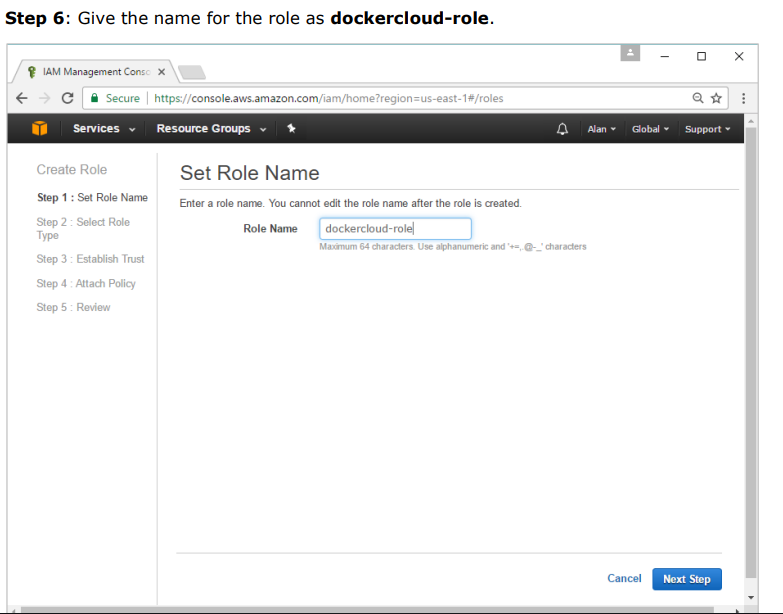
Step 5: Next, you need to create a role which will be used by Docker to spin up nodes on AWS.
For this, go to the Roles section in AWS and click the Create New Role option.
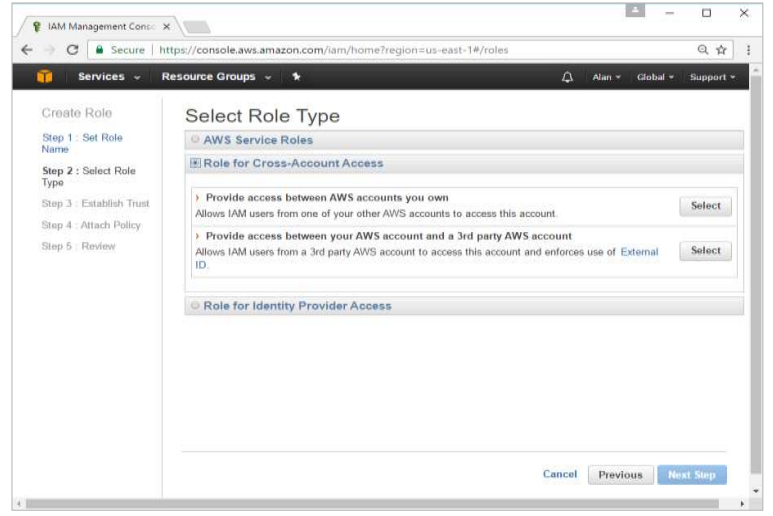
Step 7: On the next screen, go to ‘Role for Cross Account Access’ and select “Provide access between your account and a 3rd party AWS account”
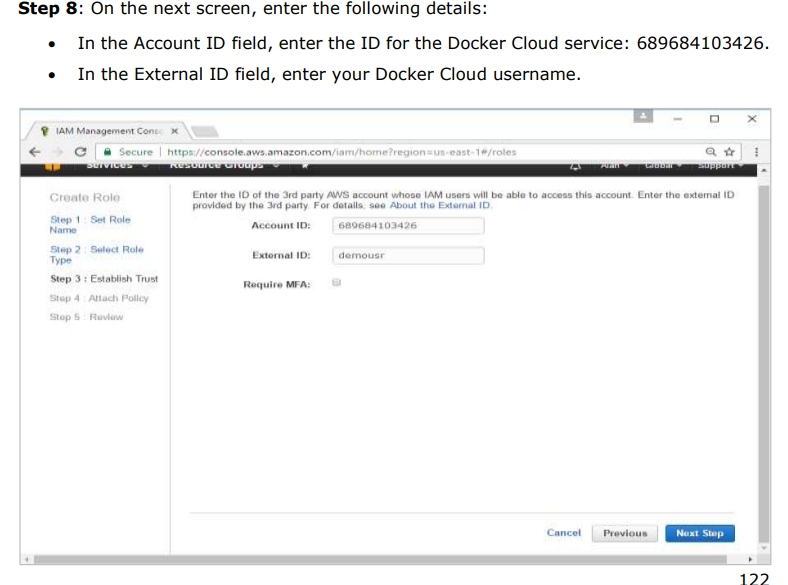
Setting Up Nodes:
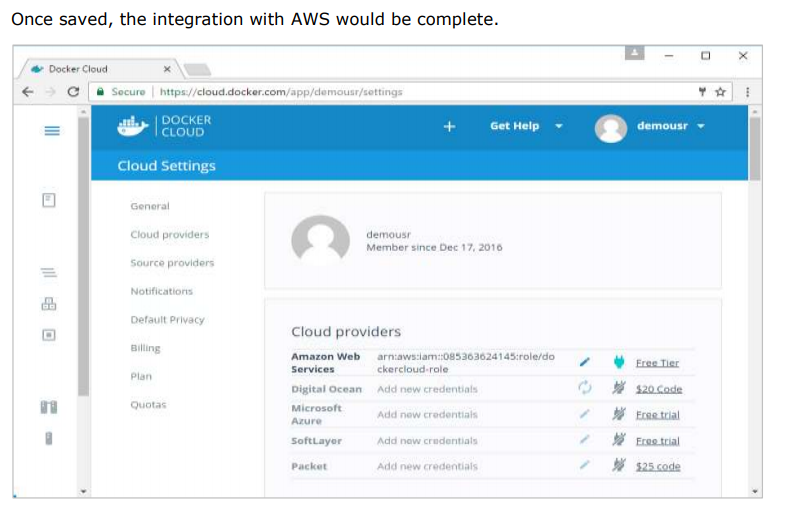
Once the integration with AWS is complete, the next step is to setup a node.
Go to the Nodes section in Docker Cloud. Note that the setting up of nodes will automatically setup a node cluster first.
Step 1: Go to the Nodes section in Docker Cloud.
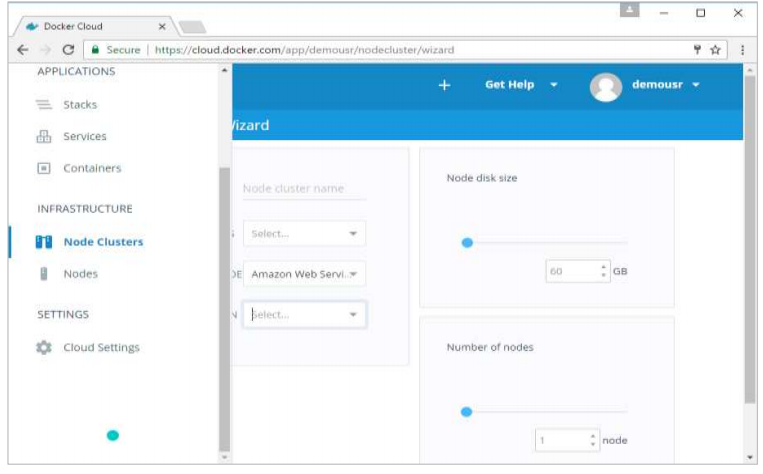
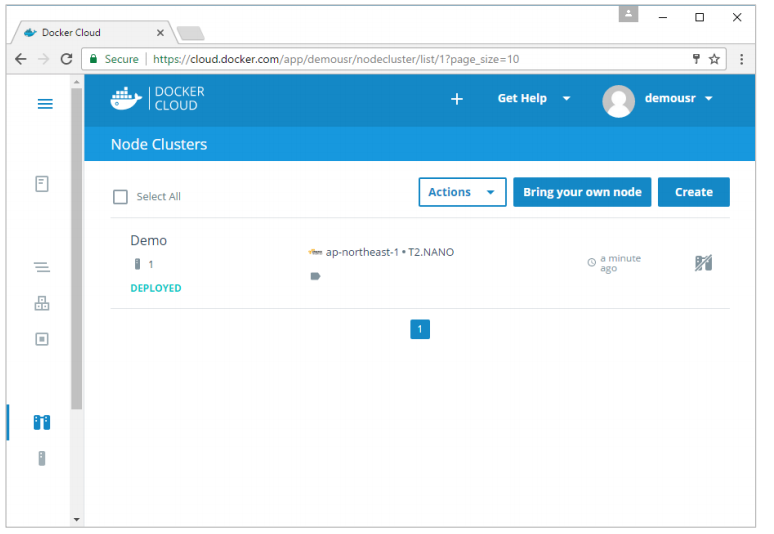
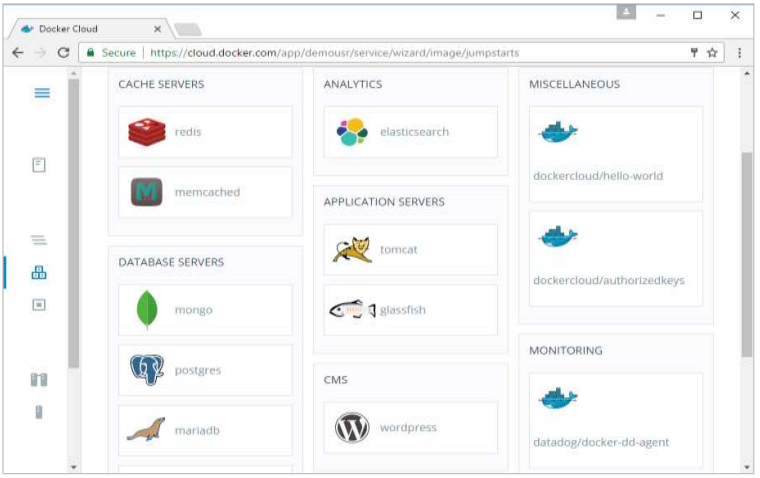
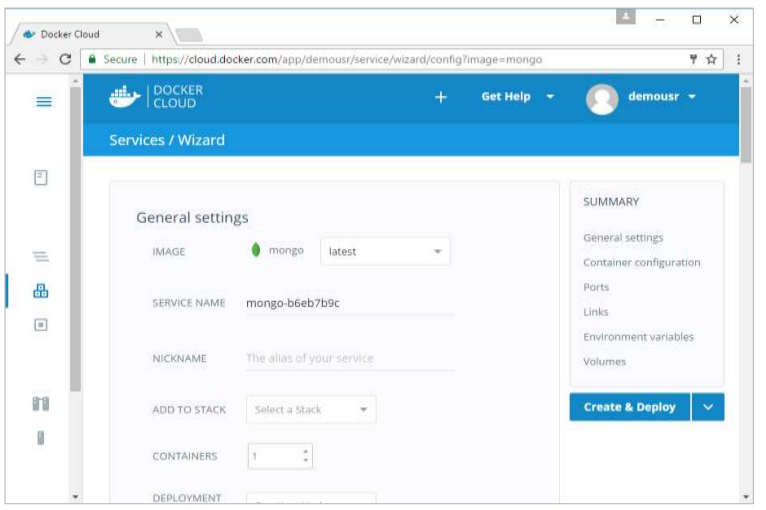
Step 2: Choose the Service which is required. In our case, let’s choose mongo.
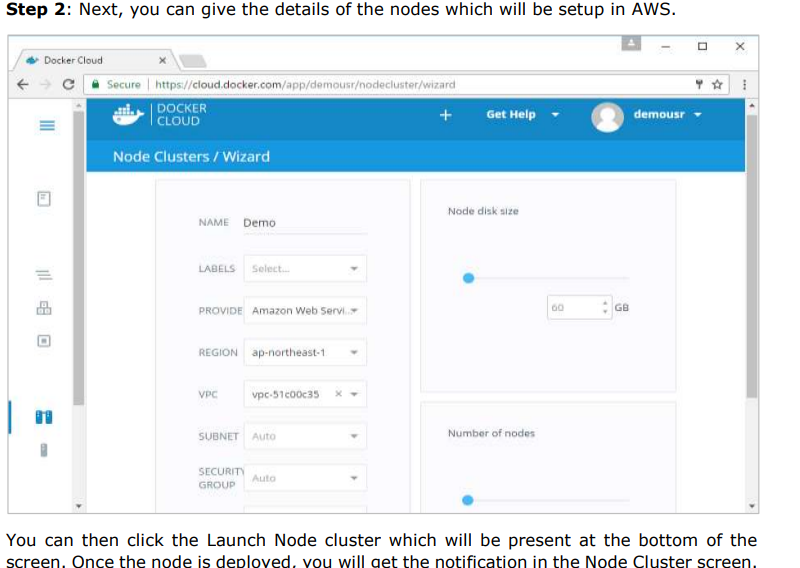
Step 3: On the next screen, choose the Create & Deploy option. This will start deploying the Mongo container on your node cluster.
Once deployed, you will be able to see the container in a running state.
5.Docker – Docker Compose:
Docker Compose is used to run multiple containers as a single service.
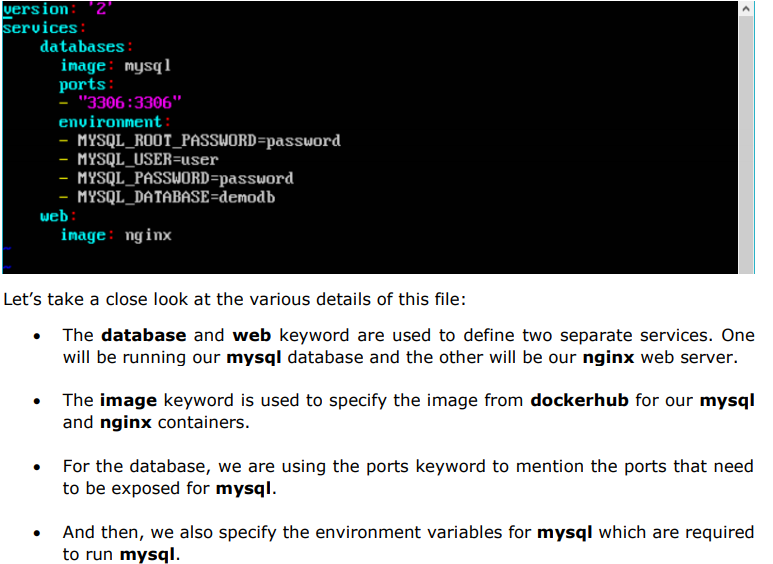
For example, suppose you had an application which required NGNIX and MySQL, you could create one file which would start both the containers as a service without the need to start each one separately.
5.1 Docker Compose ─Installation:
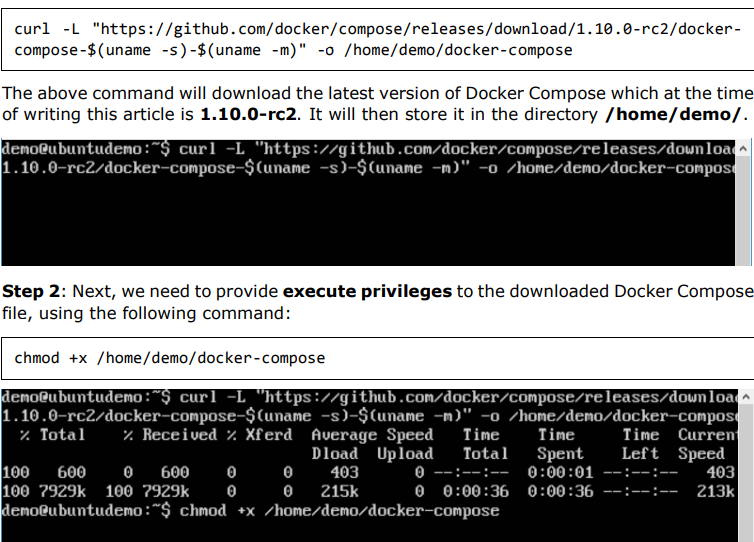
Step 1: Download the necessary files from github using the following command:
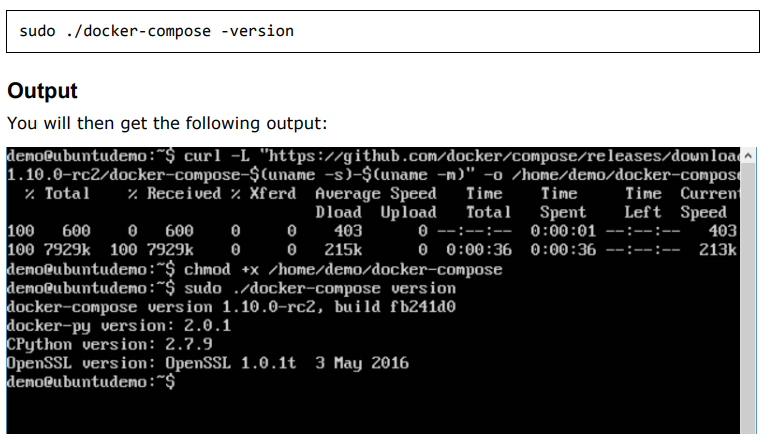
We can then use the following command to see the compose version.
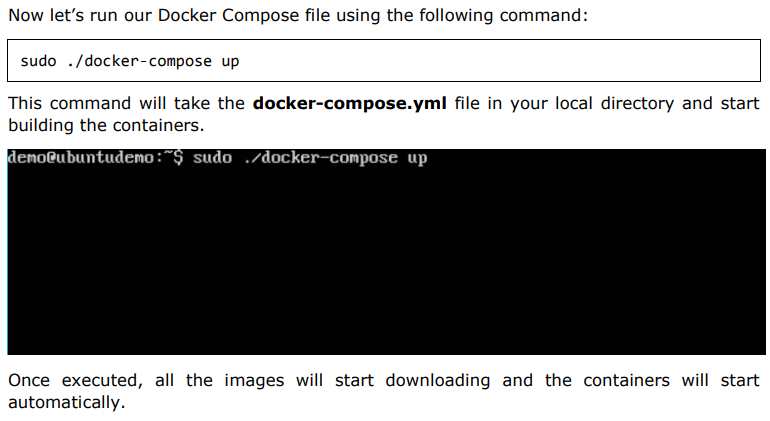
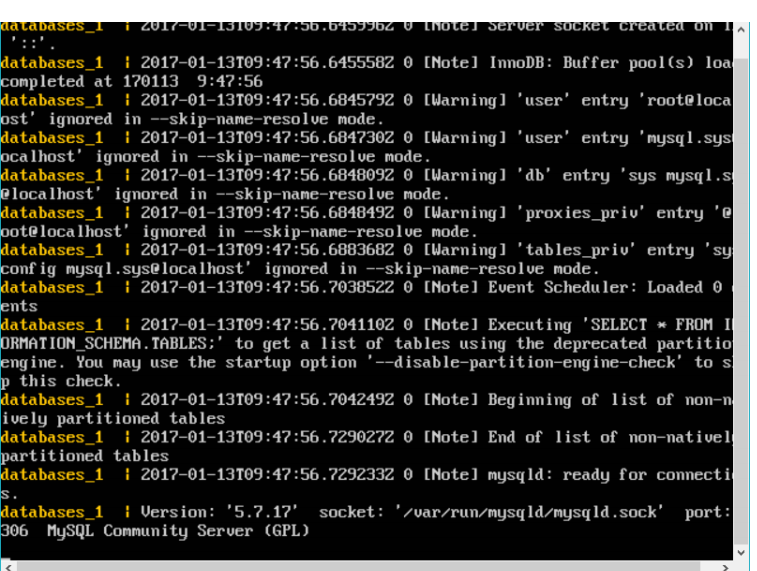
5.2 Creating Your First Docker-Compose File:
Now let’s go ahead and create our first Docker Compose file. All Docker Compose files are YAML files. You can create one using the vim editor. So execute the following command to create the compose file:
- Docker – Continuous Integration:
Docker has integrations with many Continuous Integrations tools, which also includes the popular CI tool known as Jenkins. Within Jenkins, you have plugins available which can be used to work with containers.
So let’s quickly look at a Docker plugin available for the Jenkins tool. Let’s go step by step and see what’s available in Jenkins for Docker containers.
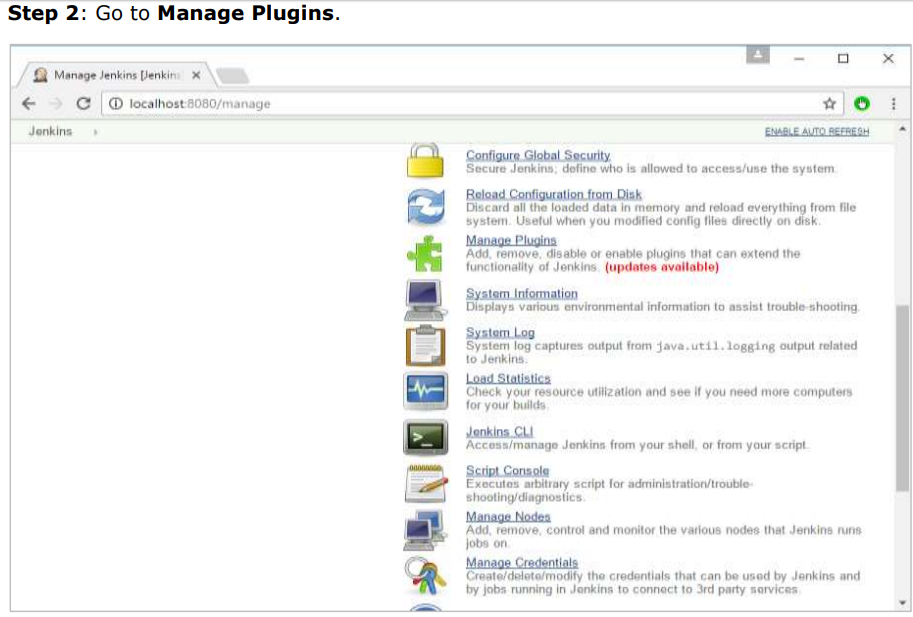
Step 1: Go to your Jenkins dashboard and click Manage Jenkins.
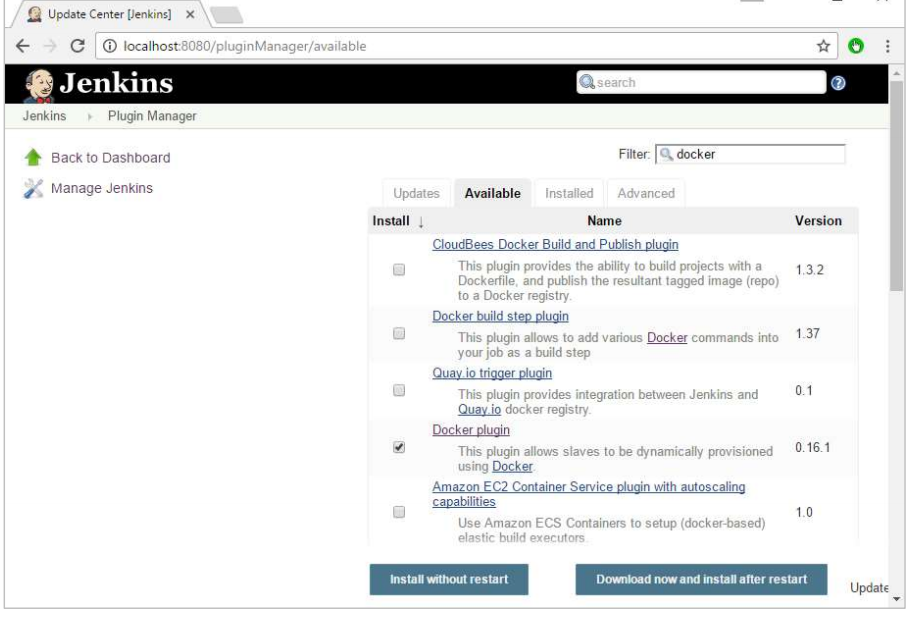
Step 3: Search for Docker plugins. Choose the Docker plugin and click the Install without restart button.
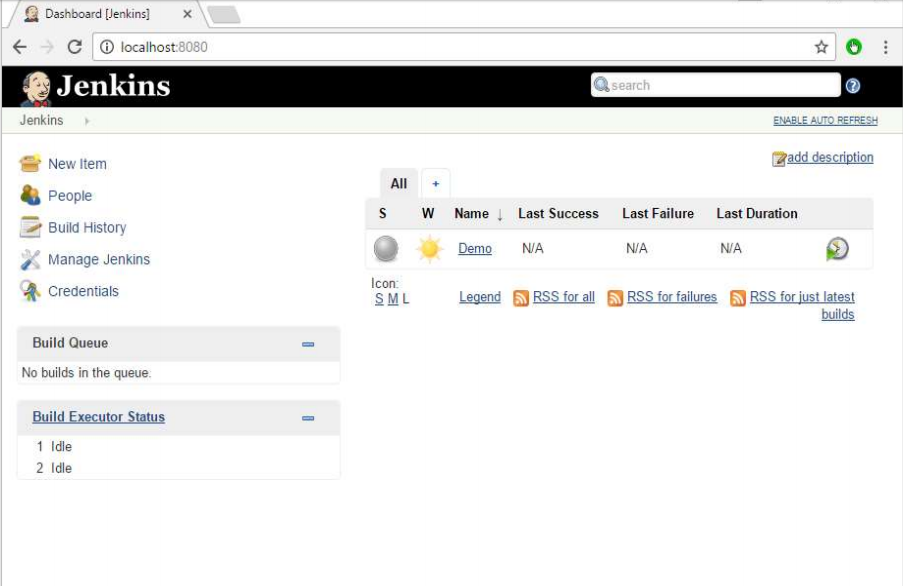
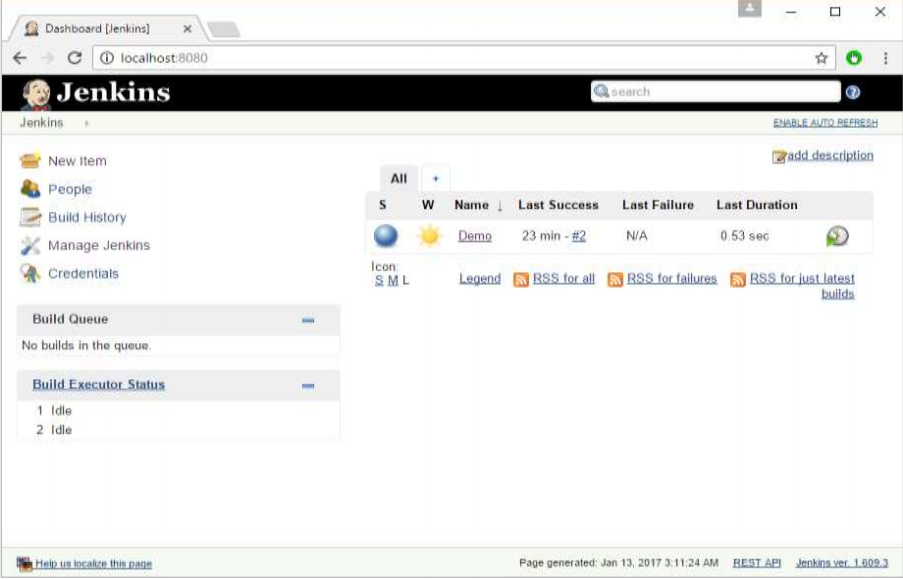
Step 4: Once the installation is completed, go to your job in the Jenkins dashboard. In our example, we have a job called Demo.
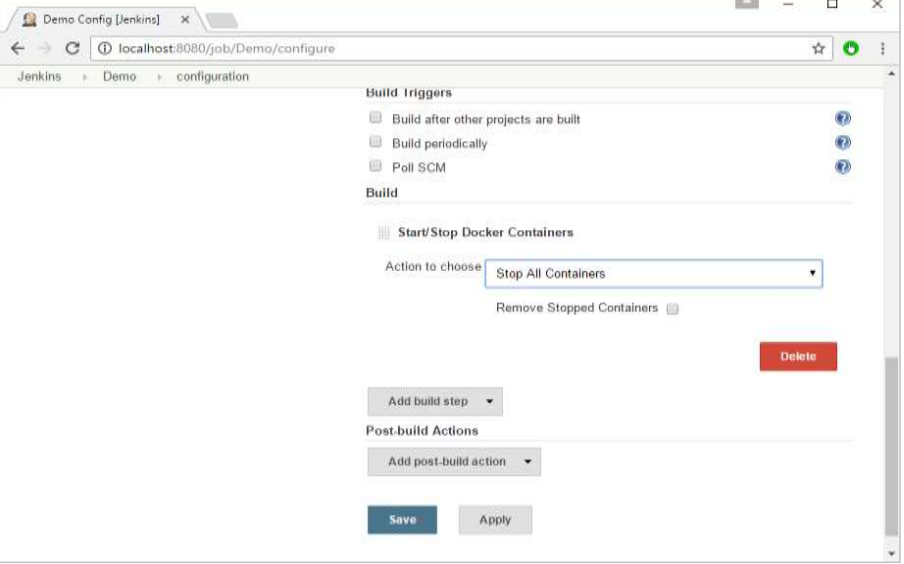
Step 5: In the job, when you go to the Build step, you can now see the option to start and stop containers.
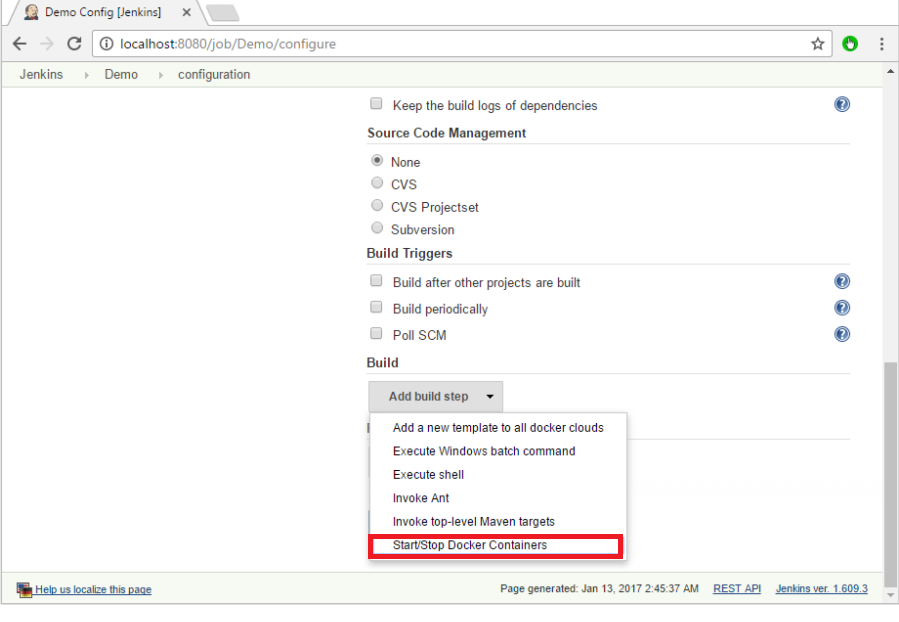
Step 6: As a simple example, you can choose the further option to stop containers when the build is completed. Then, click the Save button.
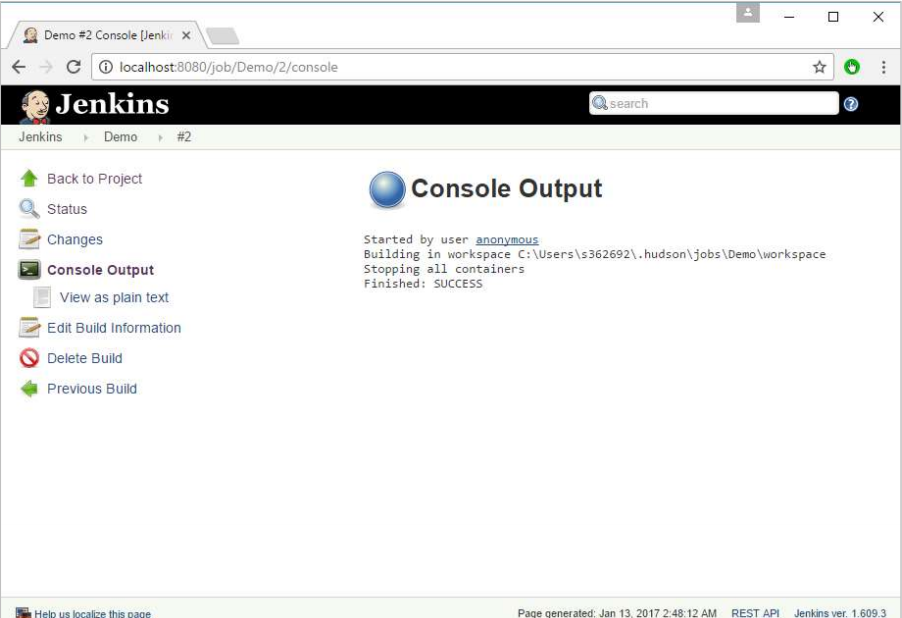
Now, just run your job in Jenkins. In the Console output, you will now be able to see that the command to Stop All containers has run.
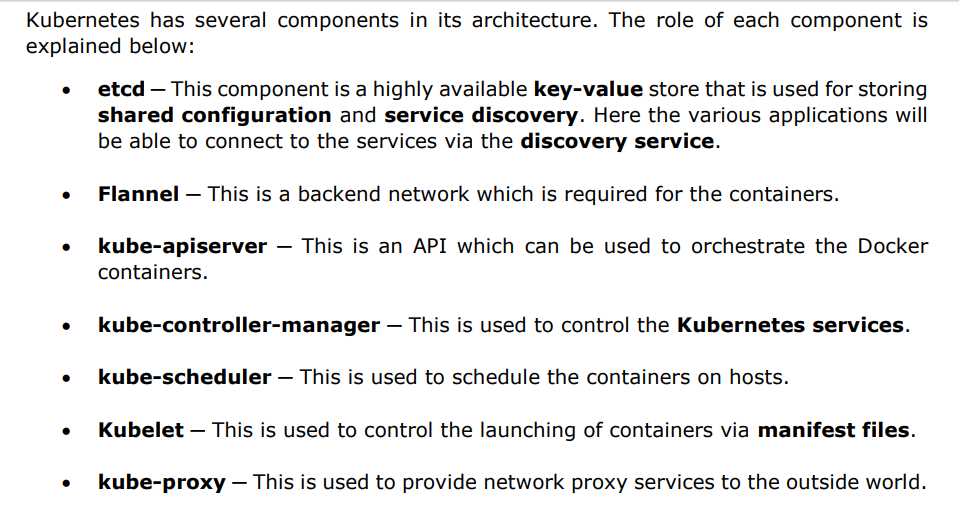
- Docker – Kubernetes Architecture:
Kubernetes is an orchestration framework for Docker containers which helps expose containers as services to the outside world. For example, you can have two services:
One service would contain nginx and mongoDB, and another service would contain nginx and redis. Each service can have an IP or service point which can be connected by other applications.
Kubernetes is then used to manage these services.
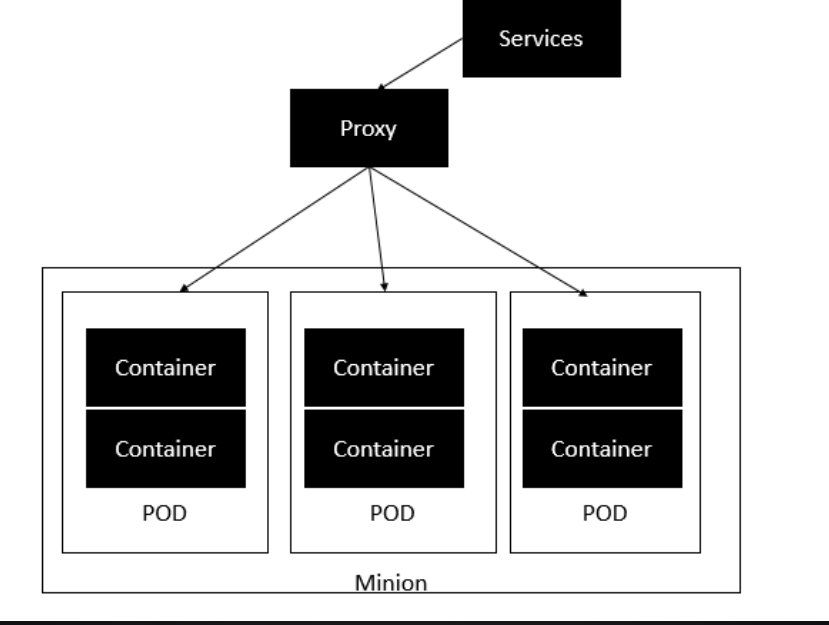
- The minion is the node on which all the services run. You can have many minions running at one point in time.
- Each minion will host one or more POD. Each POD is like hosting a service. Each POD then contains the Docker containers.
- Each POD can host a different set of Docker containers.
- The proxy is then used to control the exposing of these services to the outside world.
7.1 Docker – Working of Kubernetes:
Step 1: Ensure that the Ubuntu server version you are working on is 16.04.
Step 2: Ensure that you generate a ssh key which can be used for ssh login. You can do this using the following command:
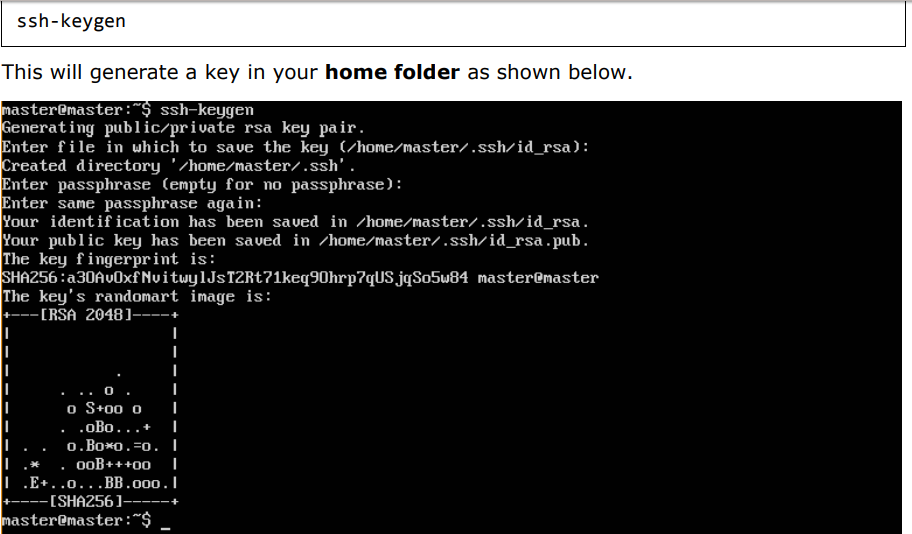
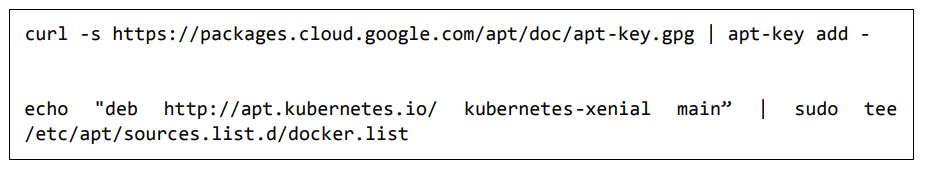
Step 3: Next, depending on the version of Ubuntu you have, you will need to add the relevant site to the docker.list for the apt package manager, so that it will be able to detect the Kubernetes packages from the kubernetes site and download them accordingly.
We can do it using the following commands:
Step 5: Install the Docker package as detailed in the earlier chapters.
Step 6: Now it’s time to install kubernetes by installing the following packages:
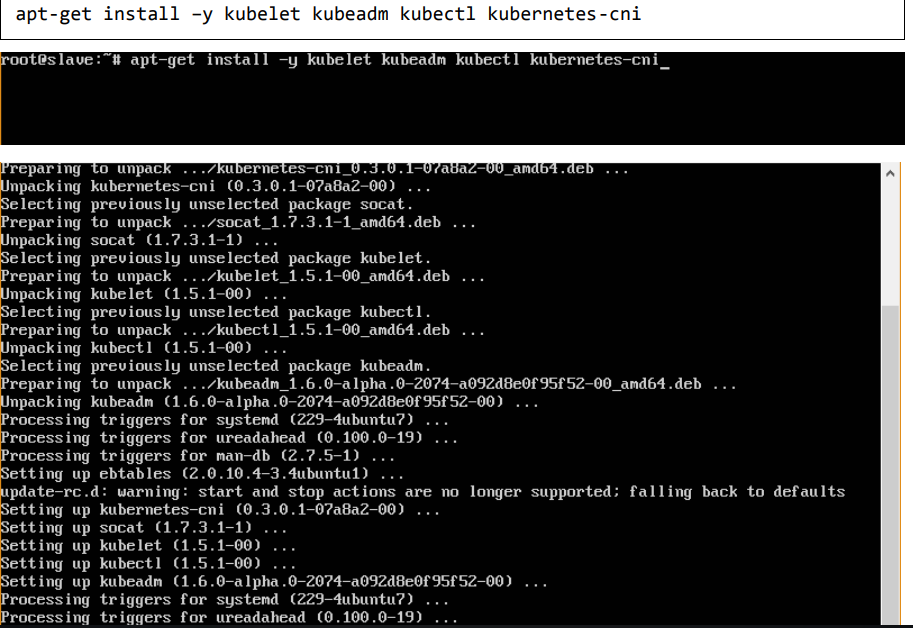
Step 7: Once all kubernetes packages are downloaded, it’s time to start the kubernetes controller using the following command:
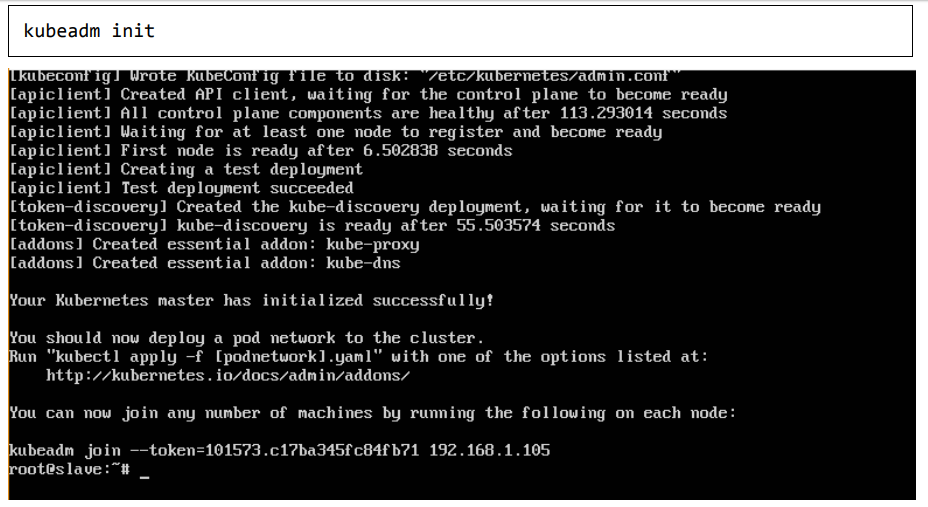
Once done, you will get a successful message that the master is up and running and nodes can now join the cluster.