Introduction:
In this part, we are going to monitor Linux service using Nagiosxi as monitoring tool.
Here are the Ip’s which we are going to use for demo purpose.
110.x.x.69——>Nagios Core Server(Nagiosxi)
110.x.x.67——>Centos as client (machine whose service is going to be monitored).
Configuration on Client Machine:
In this section we are going to doing configuration on centos(i.e on Linux as cilent machine.)
Now,configure 110.x.x.67.
[root@nagios-linux-test~]#yum install epel-release

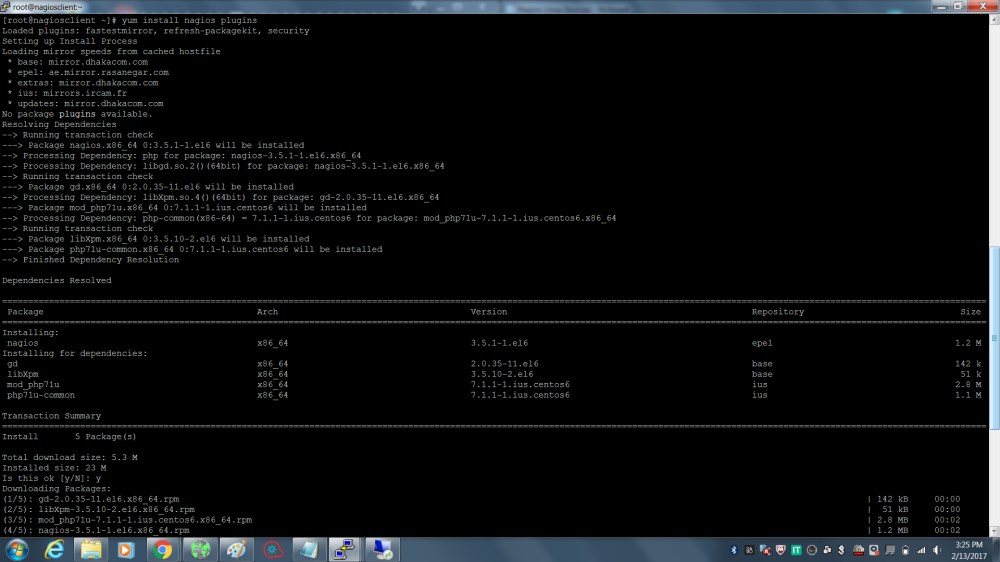
[root@nagios-linux-test~]#yum install nagios plugins
Now, We need to stop the firewall on both machines(i.e on centos as client m/c and also on nagios server machine.)
To do this use the following command
[root@nagiosclient ~]# service iptables stop

Firewall is stopped now.
Now, We need to create the script,which gives us the current status of particular service(i.e Status is either “OK-Running” or “Critical-Not running”).
So,go to the following path to create script file.
[root@nagiosclient ~]# cd /usr/lib64/nagios/plugins/
or
[root@nagiosclient~]#cd /usr/local/nagios/libexec
[root@nagiosclient plugins]#vi check_httpd.sh
and paste following content.
***********************************************
#!/bin/sh
service httpd status | grep running
case $? in
0)
echo “OK httpd is Running”
exit 0
;;
1)
echo “Critical httpd not running”
exit 2
;;
*)
echo “UNKONWN – Failed to connect”
exit 3
;;
esac
************************************************
then press “esc” after that :wq (enter).
Now change the permissions of that “check_httpd.sh” file for that use following command-
[root@nagiosclient plugins]#chmod 777 check_httpd.sh( hit enter)
[root@nagiosclient plugins]#ls
when You type the ls command then color of “check_httpd.sh” file changes from white to green.
Configuring NRPE Command:
First we’ll create a command in the “/usr/local/nagios/etc/nrpe.cfg” file that will perform the restart command. Establish a terminal or SSH session to your Linux server as the root user and execute the following command:
[root@nagiosclient~]#vi /usr/local/nagios/etc/nrpe.cfg
OR
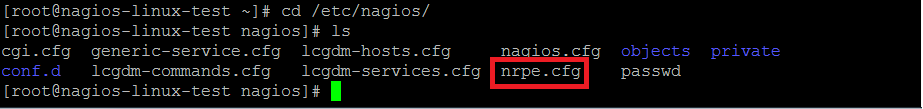
[root@nagiosclient~]#vi /etc/nagios/nrpe.cfg
When using the vi editor, to make changes press i on the keyboard first to enter insert mode. Press Esc to exit insert mode.
Go to the end of the file by pressing Shift + G and add the following line:
command[service_restart]=sudo service $ARG1$ restart

When you have finished, save the changes in vi by typing:->”ESC :wq” and press Enter.
***********************************************************************
OPTIONAL:(Generally No Need to perform This Step upto next Star Line):
The nagios user will also need to be granted permissions to execute the service command. Execute the following command as root to give NRPE permission to restart services:
echo “nagios ALL = NOPASSWD: `which service`” >> /etc/sudoers
It’s very important to use the back-tick key on your keyboard around the `which service` words above, this key is commonly located to the left of the 1 key.
***********************************************************************
Testing the Commands from Nagios XI Server(From 110.x.x.69):
Now we will test from the Nagios XI server that the command you just added to the NRPE client on the Linux server is working. This example is going to restart the crond service as it is unlikely to cause any issues. Establish a terminal session to your Nagios XI server and execute the following command:
[root@nagiosclient~]#/usr/local/nagios/libexec/check_nrpe -H -p 5666 -c service_restart -a

You can see from the screenshot that we received back the results from the “service_restart” command, it appears to be working.
Create Event Handler Script:-
Next we need to create a script that will be used by Nagios XI for the event handler. The script will be called “service_restart.sh” and will be located in the “/usr/local/nagios/libexec/” directory on the Nagios XI server. Execute the following command:
[root@nagiosclient~]#vi /usr/local/nagios/libexec/service_restart.sh
When using the vi editor, to make changes press “i”on the keyboard first to enter insert mode. Press “Esc” to exit insert mode.
Now Paste the following:-
************************************************
#!/bin/sh
case “$1” in
OK)
;;
WARNING)
;;
UNKNOWN)
;;
CRITICAL)
/usr/local/nagios/libexec/check_nrpe -H “$2” -p 5666 -c service_restart -a “$3″
;;
esac
exit 0
************************************************
When you have finished, save the changes in vi by typing:->” ESC :wq”
and press Enter.
Now execute the following commands to set the correction permissions:
[root@nagiosclient~]#chown apache:nagios /usr/local/nagios/libexec/service_restart.sh
[root@nagiosclient~]#chmod 775 /usr/local/nagios/libexec/service_restart.sh
You can now test the script works by executing the following command:
[root@nagiosclient~]#/usr/local/nagios/libexec/service_restart.sh CRITICAL
You can see from the script above that it’s only when the service is in a “CRITICAL” state that the “service_restart” command will be executed.
Create Event Handler from Nagiosxi server Dashboard(i.e from 110.x.x.69):———>
Now an event handler on the Nagios XI server will be created which will be used by your services.
Navigate to Configure > Core Configuration Manager
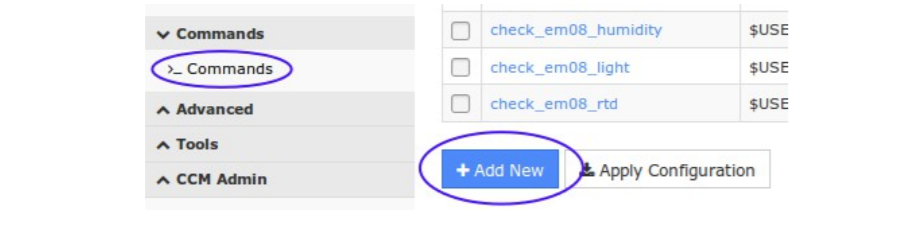
Select “Commands” from the list on the left, click the ” >_ Commands” link and then click the Add New button.
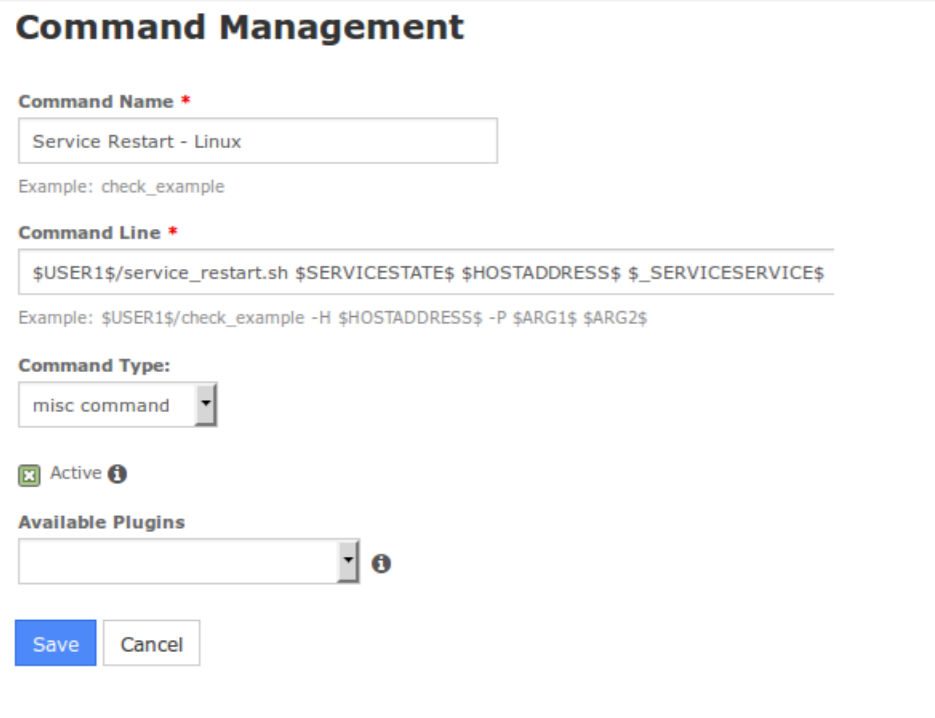
You will need to populate the fields with the following values:
Command Name: Service Restart – Linux
Command line: $USER1$/service_restart.sh $SERVICESTATE$ $HOSTADDRESS$ $_SERVICESERVICE$
Command type: misc command
Check the Active check box.
Click the Save button and then Apply Configuration.
If you didn’t get anything …Please refer the following snapshot:
For the Event handler drop down list select the option Service Restart – Linux
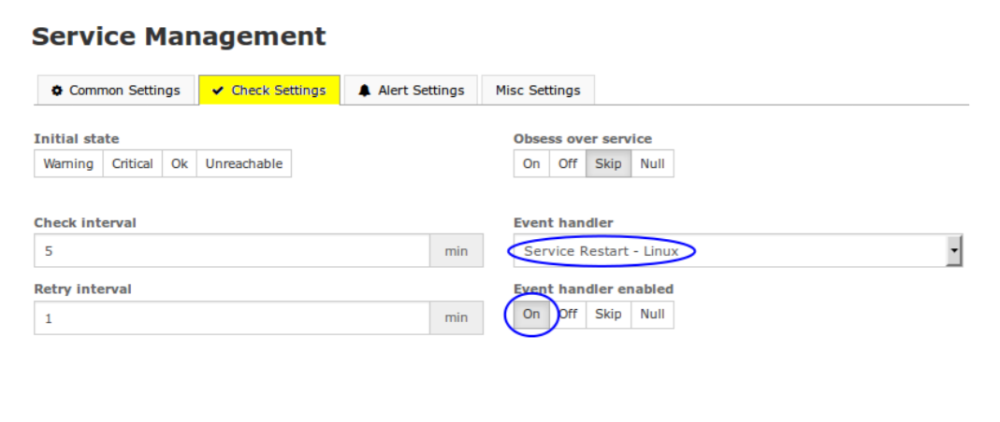
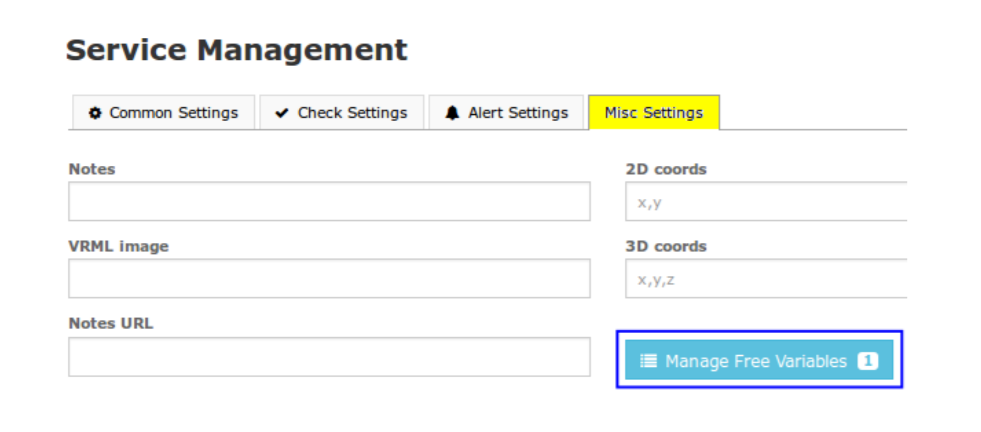
We will be adding a custom variable so that the event handler knows the name of the service to restart.
Name: _SERVICE
Value: ……………for e.g “crond” or “httpd” , etc..
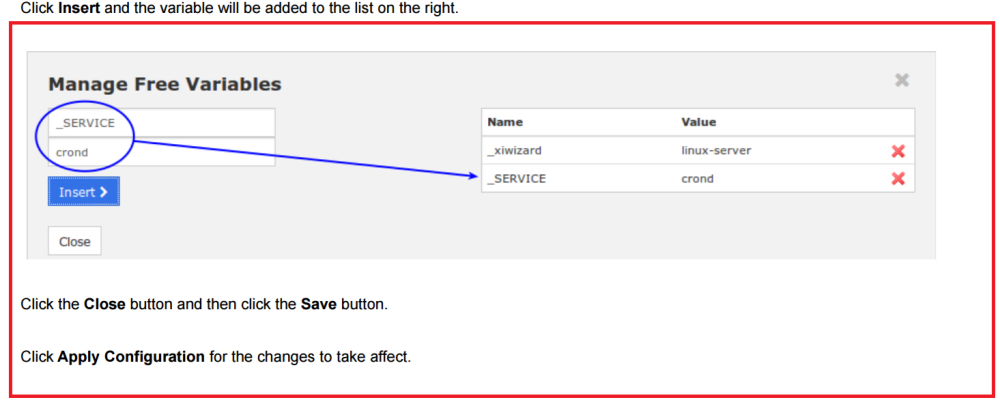
In the event handler command you created, you can see the macro “$_SERVICESERVICE$” was used. This is how a service macro is referenced by the Nagios Core engine.
Testing:
To test simply force the service to stop on the Client Linux machine. Execute the following command on your Linux machine:
[root@nagios-linux-test~]#service crond stop
Now see the dashboard(on browser).
Wait for the Nagios service to go to a critical state or force the next check. Once the Nagios XI Cron Scheduling Daemon service is in a critical state the event handler will be executed and the Linux crond service will be restarted. The next time Nagios XI checks the Cron Scheduling Daemon service it will return to an OK state as the Linux crond service will now be running.
Troubleshooting:—–>
Problem-1:
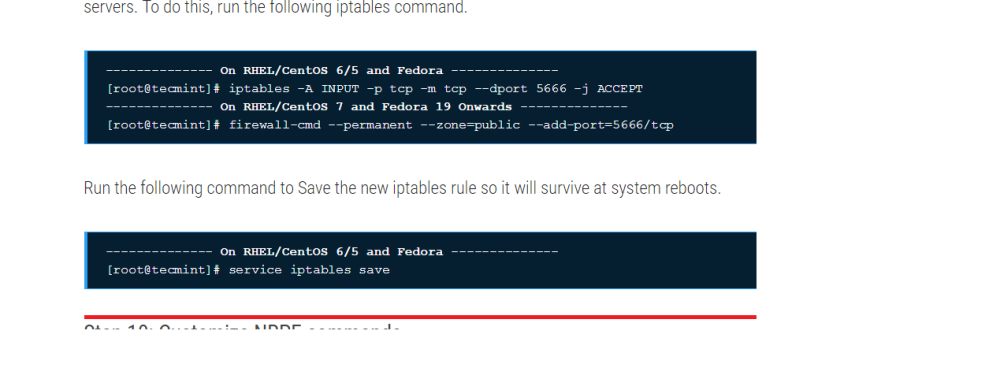
Sometimes firewall is not allowing you to communicate with other machines. That’s why see the following snapshot and add port number 5666 and port number 12489 to the firewall.:
When You are going to monitor the “httpd” service on client Linux amchine then follwing problem may occur.
Problem-2:”httpd dead but subsys locked”
Solution:
still “httpd dead but subsys locked” even following the fix of some source.
When such type of problem occurs at that moment you need to resolve the same.
for that purpose please run the following command:
[root@nagios-linux-test~]#killall -9 httpd[root@nagios-linux-test~]#sudo rm -f /var/lock/subsys/httpd[root@nagios-linux-test~]#sudo service httpd restartStopping httpd: [ OK ]
Starting httpd: [ OK ][root@nagios-linux-test nagios]# service httpd status
httpd (pid 324) is running...
If You still facing the same problem as above related to “httpd” service then please goto the following link.There You definitely get the solution:-
https://awaseroot.wordpress.com/2012/06/11/subsys-lock-problem-with-centos-6-2-and-apache/
just copy this link and past it into your browser and see the full solution for that problem.
Problem-3:“CHECK_NRPE: Error – Could not complete SSL handshake”:-
Getting error “CHECK_NRPE: Error – Could not complete SSL handshake” while connecting nagios server trying to connect remote NRPE server.
# /usr/lib64/nagios/plugins/check_nrpe -H 110.x.x.67

CHECK_NRPE: Error - Could not complete SSL handshake.
Solution:
This issue generally comes when NRPE server is not allowing to access service from Nagios server. You need to add nagios server ip in nrpe configuration file.
Step 1:
Edit NRPE configuration file /etc/nagios/nrpe.cfg and search for allowed_hosts configuration variable.
Step 2:
Add your nagios servers ip address in allowed_hosts. For multiple nagios servers add all ips with comma-delimited list. It also supports subnets (like: 110.110.110.1/24).
allowed_hosts=127.0.0.1, 192.168.10.3, 192.168.10.4
After making above changes restart nrpe service
# service nrpe restart
Step 3:
Finally verify changes again using check_nrpe command from nagios server
# /usr/lib64/nagios/plugins/check_nrpe -H 192.168.10.45

NRPE v2.14
Still If You didn’t get above problem’s solution,Please go to the following link:-
http://tecadmin.net/check-nrpe-error-could-not-complete-ssl-handshake/
Copy this link and paste into your browser and hit enter.You will get proper problem solution.
Problem:4 No route to host centos
Solution:
To solve this problem,We need to add port number 5666 to firewall
So,type the following command and hit Enter:
[root@nagios-linux-test~]#iptables -I INPUT -s 0/0 -p tcp --dport 5666 -j ACCEPTYou need to add this port for NRPE So, Instead of “INPUT”word,add “NRPE”.
Now command should be look like:
[root@nagios-linux-test~]#iptables -I NRPE -s 0/0 -p tcp --dport 5666 -j ACCEPTReference Linkfor problem no.4:
http://ask.xmodulo.com/open-port-firewall-centos-rhel.html
So, We have successfully completed the monitoring of specific service on Linux client (CentOS) machine.

Hello,
I try to ask what client OS version you had checked it?
It si working well with RHEL/OEL 7 OS-es?
Thanks,
Ferenc
LikeLike
Hi,
Sorry for late response..
I had used the centos os and those were situated at my organisation. So that’s why I couldn’t tested the same on other OS.
Thanks
LikeLike
Hi Ferenc,
Yes . I used CentOS 7 for Client as well as server machine. There is no problem for using any OS-es. If you are using different OS like ubuntu then there is little change in configuration files. Sometimes when you are going to install the NagiosXI, It will resides under “/opt/” directory or sometimes it will goes under “/etc/” directory.
I have performed for different OS-es. There were some issues faced by me also. But I resolved that.
LikeLike