DataDog(Modern monitoring & analytics)
Part-1
Reference Links:
Note: Installation performed with ubuntu 16.10
What is DataDog?
– Datadog is SAAS application.
– Datadog is a monitoring service for cloud-scale applications, which allows to monitor servers, databases, tools, and services.
– These capabilities are provided on a SaaS-based data analytics platform.
– DataDog is monitoring service for IT, operations and Develpoment teams who
write and run applications at scale and want to turn the massive amounts
of data produced by their apps,tools and services into actionable insights.
– Datadog supports to cloud infrastructure monitoring service, with a dashboard, alerting, and visualizations of metrics.
– As cloud adoption increased, Datadog grew rapidly and expanded its product offering to cover service providers including Amazon Web Services (AWS), Microsoft Azure, Google Cloud Platform, Red Hat OpenShift, and OpenStack.
Why we use DataDog?
- All cloud, servers, apps, services, metrics, and more – gets all in one place.
- It supports to HipChat, slack,pagerduty,OpsGenie and VictorOps for messaging purpose.
- Can take snapshot of a perticular graph at any time frame.
- supports with static reports with dynamic view of graphs
- can sets alert proactively(can define multiple alerts at a time.)
- allows to get metrics info in advance using restAPI call.
- provides libraries for common languages like java,node.js,perl,ruby,php,go,python.
- provides integration libraries for saltstack,ansible,freeswitch,google analytics,logstash,elasticsearch,apache2,jenkins,nginx,aws,etc….
- can write custom metrics to get perticular info related to our application
- provides log management also.
Installation:
Reference:
1. https://docs.datadoghq.com/agent/basic_agent_usage/ubuntu/
Step -1 Create free-trial account on data dog. It allows you to use data dog application for 14 days trial basis. To create account, Please visit the following link:
and click on “Free Trial” button as shown in below picture:

It will opens following:

Fill all the information and click on “SignUp” Button.
It will prompt the following. Don’t write anything inside any block. Just click on “Next” Button till step 2.
In Step 3, It will asks, that on which OS you want to install the datadog agent. So, Please select the Operating system. Once you select the os, on right hand side you will see the installation steps(i.e how to install data dog agent on particular OS’s).
Here, In this Blog, I am going to install data dog agent on ubuntu machine. So As shown below, I have selected “ubuntu” from left pane.

Here, I have selected OS as Ubuntu and follow the steps(Mostly It will take only 1st step to install the data dog-agent). Then click on “Finish”.
check whether datadog-agent service is running or not , using following command:
Command:
for ubuntu 16.04 or higher
sudo systemctl restart datadog-agent.service for Start the Agent with Ubuntu 14.04:sudo initctl start datadog-agentYou are Done with Data Dog agent installation on ubuntu machine.
After that, when you click on following link:
Go to –> login–>enter username and password–>click on login
You can see the following:

Part-1 ends here.
Part-2 Monitor Jenkins Jobs with Data Dog:
Reference Links:
https://docs.datadoghq.com/integrations/jenkins/
https://www.datadoghq.com/blog/monitor-jenkins-datadog/
- Jenkins plugin sends your build and deployment events to Datadog. From there, you can overlay them onto graphs of your other metrics so you can identify which deployments really affect your application’s performance and reliability—for better or worse.
- The plugin also tracks build times (as a metric) and statuses (as a service check), so you’ll know when your builds aren’t healthy.
The Jenkins check for the Datadog Agent is deprecated. Use the Jenkins plugin
Installation
This plugin requires Jenkins 1.580.1 or newer.
This plugin can be installed from the Update Center (found at Manage Jenkins -> Manage Plugins) in your Jenkins installation.
- Navigate to the web interface of your Jenkins installation.
- From the Update Center (found at Manage Jenkins -> Manage Plugins), under the Available tab, search for Datadog Plugin.
- Check the checkbox next to the plugin, and install using one of the two install buttons at the bottom of the screen.
- To configure the plugin, navigate to the Manage Jenkins -> Configure System page, and find the Datadog Pluginsection.
- Copy/Paste your API Key from the API Keys page on your Datadog account, into the
API Keytextbox on the configuration screen. - Before saving your configuration, test your API connection using the Test Key button, directly below the
API Keytextbox. - Restart Jenkins to get the plugin enabled.
- Optional: Set a custom Hostname You can set a custom hostname for your Jenkins host via the Hostname textbox on the same configuration screen. Note: Hostname must follow the RFC 1123 format.
Configuration:
This feature is not applicable for jenkins integration.
Validation
You will start to see Jenkins events in the Event Stream when the plugin is up and running.
Metrics
The following metrics are available in Datadog:
| METRIC NAME | DESCRIPTION |
|---|---|
jenkins.queue.size |
(Gauge) Size of your Jenkins queue |
jenkins.job.waiting |
(Gauge) Time spent by a job waiting in seconds |
jenkins.job.duration |
(Gauge) Duration of a job in seconds |
Events
The following events are generated by the plugin:
- Started build
- Finished build
Service Checks
jenkins.job.status: Build status
When you done with above steps then
login to datadog UI–>on leftpane –>dashboard lists–>search for “jenkins overview dashboard”–>click on it–>get all jenkins details at one place.
Jenkins is an open source, Java-based continuous integration server that helps organizations build, test, and deploy projects automatically. Jenkins is widely used, having been adopted by organizations like GitHub, Etsy, LinkedIn, and Datadog.
You can set up Jenkins to test and deploy your software projects every time you commit changes, to trigger new builds upon successful completion of other builds, and to run jobs on a regular schedule. With hundreds of plugins, Jenkins supports a wide variety of use cases.
As shown in the out-of-the-box dashboard below, our Datadog plugin will provide more insights into job history and trends than Jenkins’s standard weather reports. You can use the plugin to:
- Set alerts for important build failures
- Identify trends in build durations
- Correlate Jenkins events with performance metrics from other parts of your infrastructure in order to identify and resolve issues

Monitor Jenkins build status in real-time
Once you install the Jenkins-Datadog plugin, Jenkins activities (when a build starts, fails, or succeeds) will start appearing in your Datadog event stream. You will also see what percentage of builds failed within the same job, so that you can quickly spot which jobs are experiencing a higher rate of failure than others.
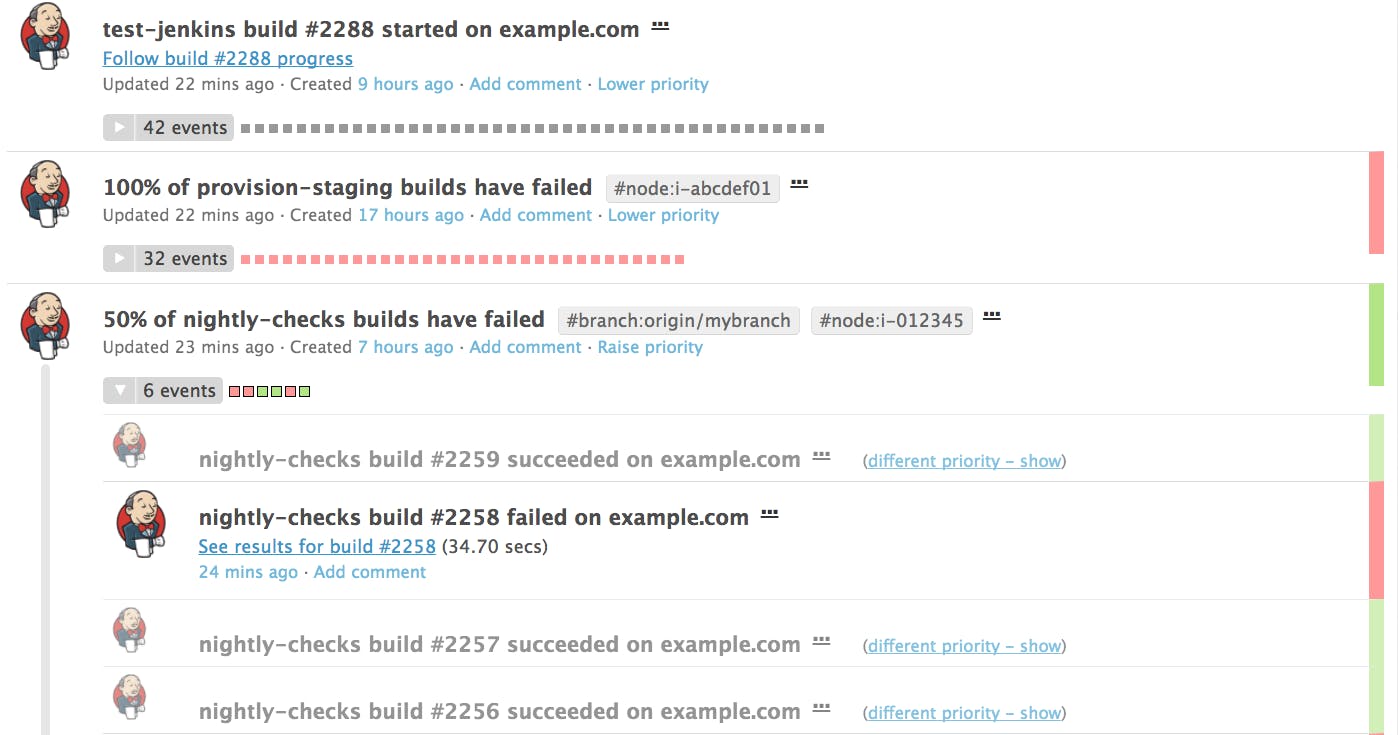
Remember to blacklist any jobs you don’t want to track by indicating them in your plugin configuration.
Datadog’s Jenkins dashboard gives you a high-level overview of how your jobs are performing. The status widget displays the current status of all jobs that have run in the past day, grouped by success or failure. To explore further, you can also click on the widget to view the jobs that have failed or succeeded in the past day.
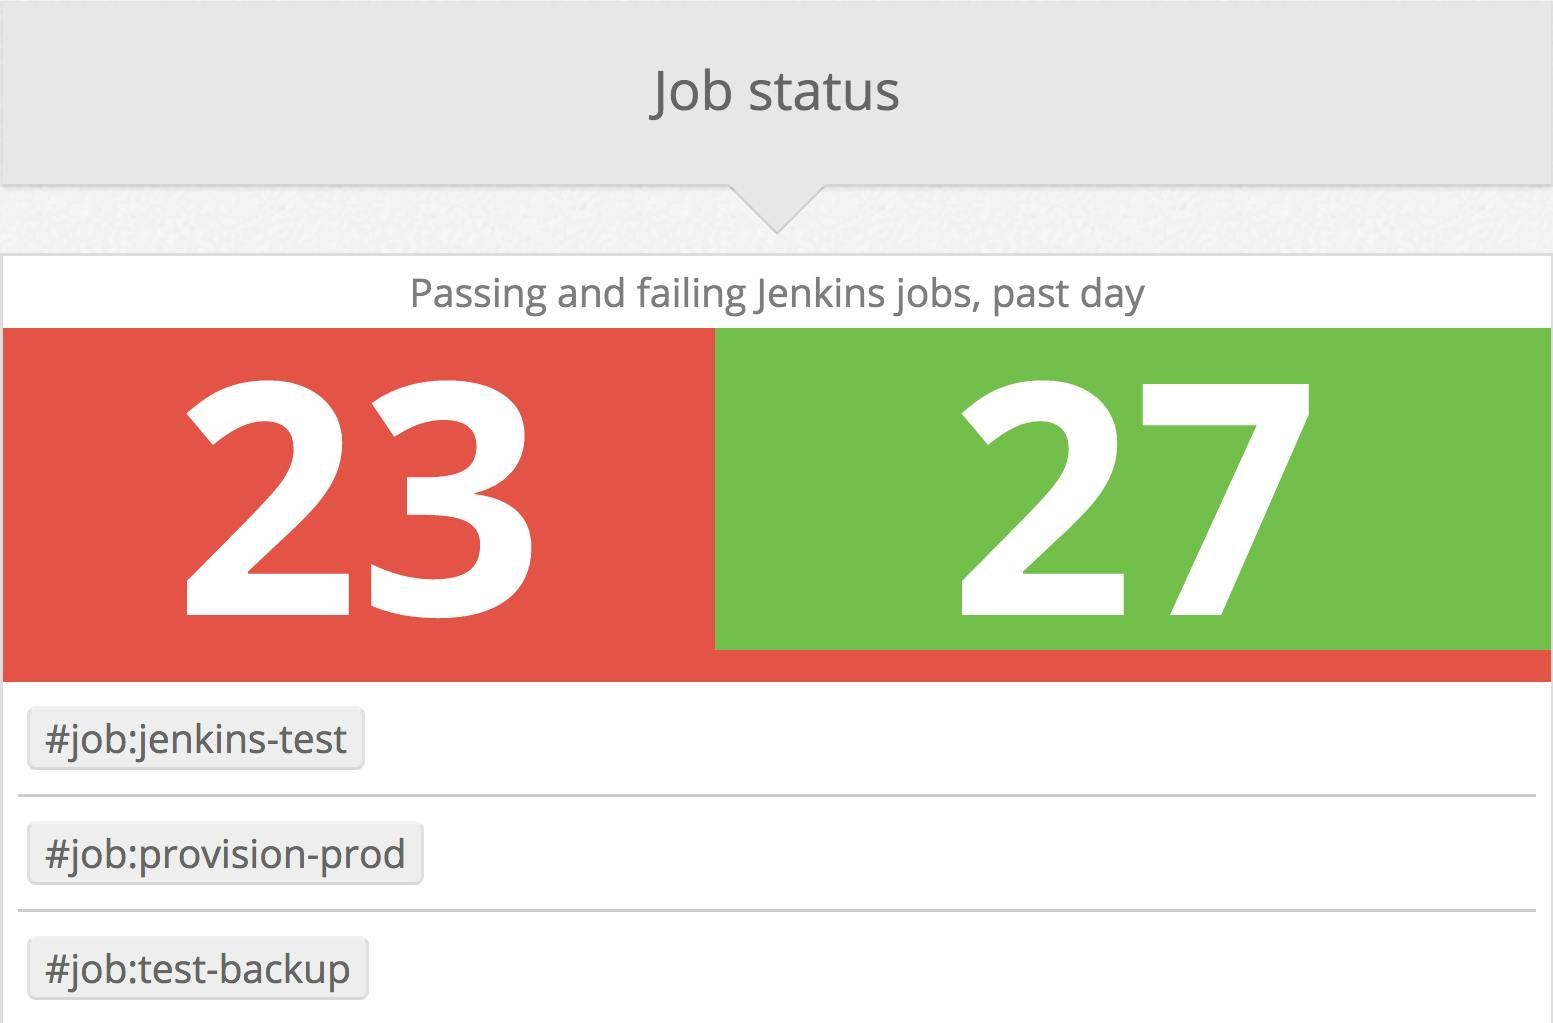
You can also see the proportion of successful vs. failed builds, along with the total number of job runs completed over the past four hours.
Datadog also enables you to correlate Jenkins events with application performance metrics to investigate the root cause of an issue. For example, the screenshot below shows that average CPU on the app servers increased sharply after a Jenkins build was completed and deployed (indicated by the pink bar). Your team can use this information as a starting point to investigate if code changes in the corresponding release may be causing the issue.

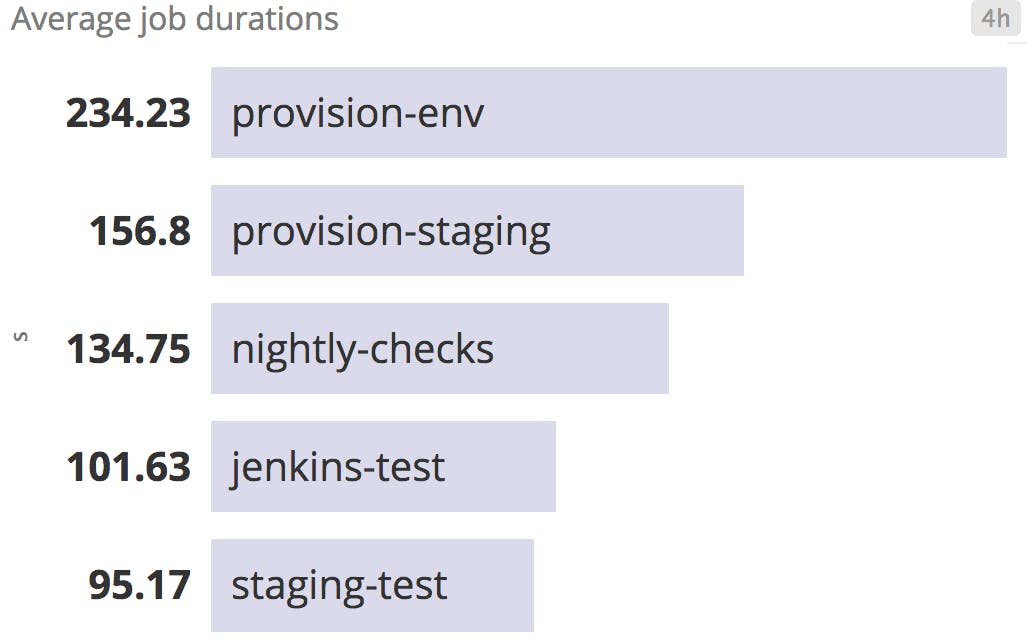
Visualize job duration metrics
Every time a build is completed, Datadog’s plugin collects its duration as a metric that you can aggregate by job name or any other tag, and graph over time. In the screenshot below, we can view the average job durations in the past four hours, sorted in decreasing order:
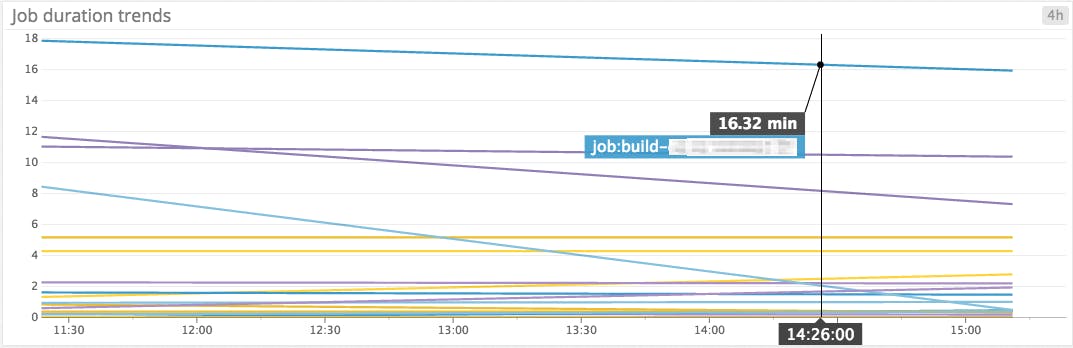
You can also graph and visualize trends in build durations for each job by using Datadog’s robust_trend() linear regression function, as shown in the screenshot below. This graph indicates which jobs’ durations are trending longer over time, so that you can investigate if there appears to be a problem. If you’re experimenting with changes to your CI pipeline, consulting this graph can help you track the effects of those changes over time.
Use tags to monitor Jenkins jobs
Tags add custom dimensions to your monitoring, so you can focus on what’s important to you right now.
Every Jenkins event, metric, and service check is auto-tagged with job, result, and branch (if applicable). You can also enable the optional node tag in the plugin settings.
As of version 0.5.0, the plugin supports custom tags. This update was developed by one of our open source contributors, Mads Nielsen. Many thanks to Mads for helping us implement this feature.
You can create custom tags for the name of the application you’re building, your particular team name (e.g. team=licorice), or any other info that matters to you. For example, if you have multiple jobs that perform nightly builds, you might want to create a descriptive tag that distinguishes them from other types of jobs.
Testing Part-2 functionality:
login to –>Jenkins –> run any single job–>after completion of this job please go to the datadog ui page and click on “Dashboard Lists”–>”Jenkins verview” dashboard.
There you can see the jenkins job details which you executed just couple of minutes ago.
Part-2 ends here
Part-3 Log collection with DataDog
Reference: https://docs.datadoghq.com/integrations/nginx/
Overview
The Datadog Agent can collect many metrics from NGINX instances, including (but not limited to)::
- Total requests
- Connections (e.g. accepted, handled, active)
For users of NGINX Plus, the commercial version of NGINX, the Agent can collect the significantly more metrics that NGINX Plus provides, like:
- Errors (e.g. 4xx codes, 5xx codes)
- Upstream servers (e.g. active connections, 5xx codes, health checks, etc.)
- Caches (e.g. size, hits, misses, etc.)
- SSL (e.g. handshakes, failed handshakes, etc.)
Setup
Installation
The NGINX check is included in the Datadog Agent package, so you don’t need to install anything else on your NGINX servers.
NGINX STATUS MODULE
The NGINX check pulls metrics from a local NGINX status endpoint, so your nginx binaries need to have been compiled with one of two NGINX status modules:
- stub status module – for open source NGINX
- http status module – only for NGINX Plus
NGINX Plus packages always include the http status module, so if you’re a Plus user, skip to Configuration now. For NGINX Plus release 13 and above, the status module is deprecated and you should use the new Plus API instead. See the announcement for more information.
If you use open source NGINX, however, your instances may lack the stub status module. Verify that your nginx binary includes the module before proceeding to Configuration:
$ nginx -V 2>&1| grep -o http_stub_status_module
http_stub_status_module
If the command output does not include http_stub_status_module, you must install an NGINX package that includes the module. You can compile your own NGINX—enabling the module as you compile it—but most modern Linux distributions provide alternative NGINX packages with various combinations of extra modules built in. Check your operating system’s NGINX packages to find one that includes the stub status module.
Configuration
Edit the nginx.d/conf.yaml file, in the conf.d/ folder at the root of your Agent’s configuration directory to start collecting your NGINX metrics and logs. See the sample nginx.d/conf.yaml for all available configuration options.
PREPARE NGINX
On each NGINX server, create a status.conf file in the directory that contains your other NGINX configuration files (e.g. /etc/nginx/conf.d/).
server {
  listen 81;
  server_name localhost;

  access_log off;
  allow 127.0.0.1;
  deny all;

  location /nginx_status {
    # Choose your status module

    # freely available with open source NGINX
    stub_status;

    # for open source NGINX < version 1.7.5
    # stub_status on;

    # available only with NGINX Plus
    # status;
  }
}
NGINX Plus can also use stub_status, but since that module provides fewer metrics, you should use status if you’re a Plus user.
You may optionally configure HTTP basic authentication in the server block, but since the service is only listening locally, it’s not necessary.
Reload NGINX to enable the status endpoint. (There’s no need for a full restart)
METRIC COLLECTION
- Add this configuration block to your
nginx.d/conf.yamlfile to start gathering your NGINX metrics:
  init_config:

  instances:
    - nginx_status_url: http://localhost:81/nginx_status/
    # If you configured the endpoint with HTTP basic authentication
    # user: <USER>
    # password: <PASSWORD>
See the sample nginx.d/conf.yaml for all available configuration options.
- Restart the Agent to start sending NGINX metrics to Datadog.
LOG COLLECTION
Available for Agent >6.0
- Collecting logs is disabled by default in the Datadog Agent, you need to enable it in
datadog.yaml:
logs_enabled: true
- Add this configuration block to your
nginx.d/conf.yamlfile to start collecting your NGINX Logs:
  logs:
    - type: file
      path: /var/log/nginx/access.log
      service: nginx
      source: nginx
      sourcecategory: http_web_access

    - type: file
      path: /var/log/nginx/error.log
      service: nginx
      source: nginx
      sourcecategory: http_web_access
Change the service and path parameter values and configure them for your environment. See the sample nginx.d/conf.yaml for all available configuration options.
Learn more about log collection in the log documentation
Validation
Run the Agent’s status subcommand and look for nginx under the Checks section.
Data Collected
Metrics
| nginx.net.writing (gauge) |
The number of connections waiting on upstream responses and/or writing responses back to the client. shown as connection |
| nginx.net.waiting (gauge) |
The number of keep-alive connections waiting for work. shown as connection |
| nginx.net.reading (gauge) |
The number of connections reading client requets. shown as connection |
| nginx.net.connections (gauge) |
The total number of active connections. shown as connection |
| nginx.net.request_per_s (gauge) |
Rate of requests processed. shown as request |
| nginx.net.conn_opened_per_s (gauge) |
Rate of connections opened. shown as connection |
| nginx.net.conn_dropped_per_s (gauge) |
Rate of connections dropped. shown as connection |
| nginx.cache.bypass.bytes (gauge) |
The total number of bytes read from the proxied server shown as byte |
| nginx.cache.bypass.bytes_count (count) |
The total number of bytes read from the proxied server (shown as count) shown as byte |
| nginx.cache.bypass.bytes_written (gauge) |
The total number of bytes written to the cache shown as byte |
| nginx.cache.bypass.bytes_written_count (count) |
The total number of bytes written to the cache (shown as count) shown as byte |
| nginx.cache.bypass.responses (gauge) |
The total number of responses not taken from the cache shown as response |
| nginx.cache.bypass.responses_count (count) |
The total number of responses not taken from the cache (shown as count) shown as response |
| nginx.cache.bypass.responses_written (gauge) |
The total number of responses written to the cache shown as response |
| nginx.cache.bypass.responses_written_count (count) |
The total number of responses written to the cache (shown as count) shown as response |
| nginx.cache.cold (gauge) |
A boolean value indicating whether the “cache loader” process is still loading data from disk into the cache shown as response |
| nginx.cache.expired.bytes (gauge) |
The total number of bytes read from the proxied server shown as byte |
| nginx.cache.expired.bytes_count (count) |
The total number of bytes read from the proxied server (shown as count) shown as byte |
| nginx.cache.expired.bytes_written (gauge) |
The total number of bytes written to the cache shown as byte |
| nginx.cache.expired.bytes_written_count (count) |
The total number of bytes written to the cache (shown as count) shown as byte |
| nginx.cache.expired.responses (gauge) |
The total number of responses not taken from the cache shown as response |
| nginx.cache.expired.responses_count (count) |
The total number of responses not taken from the cache (shown as count) shown as response |
| nginx.cache.expired.responses_written (gauge) |
The total number of responses written to the cache shown as response |
| nginx.cache.expired.responses_written_count (count) |
The total number of responses written to the cache (shown as count) shown as response |
| nginx.cache.hit.bytes (gauge) |
The total number of bytes read from the cache shown as byte |
| nginx.cache.hit.bytes_count (count) |
The total number of bytes read from the cache (shown as count) shown as byte |
| nginx.cache.hit.responses (gauge) |
The total number of responses read from the cache shown as response |
| nginx.cache.hit.responses_count (count) |
The total number of responses read from the cache (shown as count) shown as response |
| nginx.cache.max_size (gauge) |
The limit on the maximum size of the cache specified in the configuration shown as byte |
| nginx.cache.miss.bytes (gauge) |
The total number of bytes read from the proxied server shown as byte |
| nginx.cache.miss.bytes_count (count) |
The total number of bytes read from the proxied server (shown as count) shown as byte |
| nginx.cache.miss.bytes_written (gauge) |
The total number of bytes written to the cache shown as byte |
| nginx.cache.miss.bytes_written_count (count) |
The total number of bytes written to the cache (shown as count) shown as byte |
| nginx.cache.miss.responses (gauge) |
The total number of responses not taken from the cache shown as response |
| nginx.cache.miss.responses_count (count) |
The total number of responses not taken from the cache (shown as count) shown as response |
| nginx.cache.miss.responses_written (gauge) |
The total number of responses written to the cache shown as response |
| nginx.cache.miss.responses_written_count (count) |
The total number of responses written to the cache shown as response |
| nginx.cache.revalidated.bytes (gauge) |
The total number of bytes read from the cache shown as byte |
| nginx.cache.revalidated.bytes_count (count) |
The total number of bytes read from the cache (shown as count) shown as byte |
| nginx.cache.revalidated.response (gauge) |
The total number of responses read from the cache shown as responses |
| nginx.cache.revalidated.response_count (count) |
The total number of responses read from the cache (shown as count) shown as responses |
| nginx.cache.size (gauge) |
The current size of the cache shown as response |
| nginx.cache.stale.bytes (gauge) |
The total number of bytes read from the cache shown as byte |
| nginx.cache.stale.bytes_count (count) |
The total number of bytes read from the cache (shown as count) shown as byte |
| nginx.cache.stale.responses (gauge) |
The total number of responses read from the cache shown as response |
| nginx.cache.stale.responses_count (count) |
The total number of responses read from the cache (shown as count) shown as response |
| nginx.cache.updating.bytes (gauge) |
The total number of bytes read from the cache shown as byte |
| nginx.cache.updating.bytes_count (count) |
The total number of bytes read from the cache (shown as count) shown as byte |
| nginx.cache.updating.responses (gauge) |
The total number of responses read from the cache shown as response |
| nginx.cache.updating.responses_count (count) |
The total number of responses read from the cache (shown as count) shown as response |
| nginx.connections.accepted (gauge) |
The total number of accepted client connections. shown as connection |
| nginx.connections.accepted_count (count) |
The total number of accepted client connections (shown as count). shown as connection |
| nginx.connections.active (gauge) |
The current number of active client connections. shown as connection |
| nginx.connections.dropped (gauge) |
The total number of dropped client connections. shown as connection |
| nginx.connections.dropped_count (count) |
The total number of dropped client connections (shown as count). shown as connection |
| nginx.connections.idle (gauge) |
The current number of idle client connections. shown as connection |
| nginx.generation (gauge) |
The total number of configuration reloads shown as reload |
| nginx.generation_count (count) |
The total number of configuration reloads (shown as count) shown as reload |
| nginx.load_timestamp (gauge) |
Time of the last reload of configuration (time since Epoch). shown as millisecond |
| nginx.pid (gauge) |
The ID of the worker process that handled status request. |
| nginx.ppid (gauge) |
The ID of the master process that started the worker process |
| nginx.processes.respawned (gauge) |
The total number of abnormally terminated and respawned child processes. shown as process |
| nginx.processes.respawned_count (count) |
The total number of abnormally terminated and respawned child processes (shown as count). shown as process |
| nginx.requests.current (gauge) |
The current number of client requests. shown as request |
| nginx.requests.total (gauge) |
The total number of client requests. shown as request |
| nginx.requests.total_count (count) |
The total number of client requests (shown as count). shown as request |
| nginx.server_zone.discarded (gauge) |
The total number of requests completed without sending a response. shown as request |
| nginx.server_zone.discarded_count (count) |
The total number of requests completed without sending a response (shown as count). shown as request |
| nginx.server_zone.processing (gauge) |
The number of client requests that are currently being processed. shown as request |
| nginx.server_zone.received (gauge) |
The total amount of data received from clients. shown as byte |
| nginx.server_zone.received_count (count) |
The total amount of data received from clients (shown as count). shown as byte |
| nginx.server_zone.requests (gauge) |
The total number of client requests received from clients. shown as request |
| nginx.server_zone.requests_count (count) |
The total number of client requests received from clients (shown as count). shown as request |
| nginx.server_zone.responses.1xx (gauge) |
The number of responses with 1xx status code. shown as response |
| nginx.server_zone.responses.1xx_count (count) |
The number of responses with 1xx status code (shown as count). shown as response |
| nginx.server_zone.responses.2xx (gauge) |
The number of responses with 2xx status code. shown as response |
| nginx.server_zone.responses.2xx_count (count) |
The number of responses with 2xx status code (shown as count). shown as response |
| nginx.server_zone.responses.3xx (gauge) |
The number of responses with 3xx status code. shown as response |
| nginx.server_zone.responses.3xx_count (count) |
The number of responses with 3xx status code (shown as count). shown as response |
| nginx.server_zone.responses.4xx (gauge) |
The number of responses with 4xx status code. shown as response |
| nginx.server_zone.responses.4xx_count (count) |
The number of responses with 4xx status code (shown as count). shown as response |
| nginx.server_zone.responses.5xx (gauge) |
The number of responses with 5xx status code. shown as response |
| nginx.server_zone.responses.5xx_count (count) |
The number of responses with 5xx status code (shown as count). shown as response |
| nginx.server_zone.responses.total (gauge) |
The total number of responses sent to clients. shown as response |
| nginx.server_zone.responses.total_count (count) |
The total number of responses sent to clients (shown as count). shown as response |
| nginx.server_zone.sent (gauge) |
The total amount of data sent to clients. shown as byte |
| nginx.server_zone.sent_count (count) |
The total amount of data sent to clients (shown as count). shown as byte |
| nginx.slab.pages.free (gauge) |
The current number of free memory pages shown as page |
| nginx.slab.pages.used (gauge) |
The current number of used memory pages shown as page |
| nginx.slab.slots.fails (gauge) |
The number of unsuccessful attempts to allocate memory of specified size shown as request |
| nginx.slab.slots.fails_count (count) |
The number of unsuccessful attempts to allocate memory of specified size (shown as count) shown as request |
| nginx.slab.slots.free (gauge) |
The current number of free memory slots shown as slot |
| nginx.slab.slots.reqs (gauge) |
The total number of attempts to allocate memory of specified size shown as request |
| nginx.slab.slots.reqs_count (count) |
The total number of attempts to allocate memory of specified size (shown as count) shown as request |
| nginx.slab.slots.used (gauge) |
The current number of used memory slots shown as slot |
| nginx.ssl.handshakes (gauge) |
The total number of successful SSL handshakes. |
| nginx.ssl.handshakes_count (count) |
The total number of successful SSL handshakes (shown as count). |
| nginx.ssl.handshakes_failed (gauge) |
The total number of failed SSL handshakes. |
| nginx.ssl.handshakes_failed_count (count) |
The total number of failed SSL handshakes (shown as count). |
| nginx.ssl.session_reuses (gauge) |
The total number of session reuses during SSL handshake. |
| nginx.ssl.session_reuses_count (count) |
The total number of session reuses during SSL handshake (shown as count). |
| nginx.stream.server_zone.connections (gauge) |
The total number of connections accepted from clients shown as connection |
| nginx.stream.server_zone.connections_count (count) |
The total number of connections accepted from clients (shown as count) shown as connection |
| nginx.stream.server_zone.discarded (gauge) |
The total number of requests completed without sending a response. shown as request |
| nginx.stream.server_zone.discarded_count (count) |
The total number of requests completed without sending a response (shown as count). shown as request |
| nginx.stream.server_zone.processing (gauge) |
The number of client requests that are currently being processed. shown as request |
| nginx.stream.server_zone.received (gauge) |
The total amount of data received from clients. shown as byte |
| nginx.stream.server_zone.received_count (count) |
The total amount of data received from clients (shown as count). shown as byte |
| nginx.stream.server_zone.sent (gauge) |
The total amount of data sent to clients. shown as byte |
| nginx.stream.server_zone.sent_count (count) |
The total amount of data sent to clients (shown as count). shown as byte |
| nginx.stream.server_zone.sessions.2xx (gauge) |
The number of responses with 2xx status code. shown as session |
| nginx.stream.server_zone.sessions.2xx_count (count) |
The number of responses with 2xx status code (shown as count). shown as session |
| nginx.stream.server_zone.sessions.4xx (gauge) |
The number of responses with 4xx status code. shown as session |
| nginx.stream.server_zone.sessions.4xx_count (count) |
The number of responses with 4xx status code (shown as count). shown as session |
| nginx.stream.server_zone.sessions.5xx (gauge) |
The number of responses with 5xx status code. shown as session |
| nginx.stream.server_zone.sessions.5xx_count (count) |
The number of responses with 5xx status code (shown as count). shown as session |
| nginx.stream.server_zone.sessions.total (gauge) |
The total number of responses sent to clients. shown as session |
| nginx.stream.server_zone.sessions.total_count (count) |
The total number of responses sent to clients (shown as count). shown as session |
| nginx.stream.upstream.peers.active (gauge) |
The current number of connections shown as connection |
| nginx.stream.upstream.peers.backup (gauge) |
A boolean value indicating whether the server is a backup server. |
| nginx.stream.upstream.peers.connections (gauge) |
The total number of client connections forwarded to this server. shown as connection |
| nginx.stream.upstream.peers.connections_count (count) |
The total number of client connections forwarded to this server (shown as count). shown as connection |
| nginx.stream.upstream.peers.downstart (gauge) |
The time (time since Epoch) when the server became “unavail” or “checking” or “unhealthy” shown as millisecond |
| nginx.stream.upstream.peers.downtime (gauge) |
Total time the server was in the “unavail” or “checking” or “unhealthy” states. shown as millisecond |
| nginx.stream.upstream.peers.fails (gauge) |
The total number of unsuccessful attempts to communicate with the server. shown as fail |
| nginx.stream.upstream.peers.fails_count (count) |
The total number of unsuccessful attempts to communicate with the server (shown as count). shown as fail |
| nginx.stream.upstream.peers.health_checks.checks (gauge) |
The total number of health check requests made. shown as request |
| nginx.stream.upstream.peers.health_checks.checks_count (count) |
The total number of health check requests made (shown as count). shown as request |
| nginx.stream.upstream.peers.health_checks.fails (gauge) |
The number of failed health checks. shown as fail |
| nginx.stream.upstream.peers.health_checks.fails_count (count) |
The number of failed health checks (shown as count). shown as fail |
| nginx.stream.upstream.peers.health_checks.last_passed (gauge) |
Boolean indicating if the last health check request was successful and passed tests. |
| nginx.stream.upstream.peers.health_checks.unhealthy (gauge) |
How many times the server became unhealthy (state “unhealthy”). |
| nginx.stream.upstream.peers.health_checks.unhealthy_count (count) |
How many times the server became unhealthy (state “unhealthy”) (shown as count). |
| nginx.stream.upstream.peers.id (gauge) |
The ID of the server. |
| nginx.stream.upstream.peers.received (gauge) |
The total number of bytes received from this server. shown as byte |
| nginx.stream.upstream.peers.received_count (count) |
The total number of bytes received from this server (shown as count). shown as byte |
| nginx.stream.upstream.peers.selected (gauge) |
The time (time since Epoch) when the server was last selected to process a connection. shown as millisecond |
| nginx.stream.upstream.peers.sent (gauge) |
The total number of bytes sent to this server. shown as byte |
| nginx.stream.upstream.peers.sent_count (count) |
The total number of bytes sent to this server (shown as count). shown as byte |
| nginx.stream.upstream.peers.unavail (gauge) |
How many times the server became unavailable for client connections (state “unavail”). |
| nginx.stream.upstream.peers.unavail_count (count) |
How many times the server became unavailable for client connections (state “unavail”) (shown as count). |
| nginx.stream.upstream.peers.weight (gauge) |
Weight of the server. |
| nginx.stream.upstream.zombies (gauge) |
The current number of servers removed from the group but still processing active client connections. shown as server |
| nginx.timestamp (gauge) |
Current time since Epoch. shown as millisecond |
| nginx.upstream.keepalive (gauge) |
The current number of idle keepalive connections. shown as connection |
| nginx.upstream.peers.active (gauge) |
The current number of active connections. shown as connection |
| nginx.upstream.peers.backup (gauge) |
A boolean value indicating whether the server is a backup server. |
| nginx.upstream.peers.downstart (gauge) |
The time (since Epoch) when the server became “unavail” or “unhealthy”. shown as millisecond |
| nginx.upstream.peers.downtime (gauge) |
Total time the server was in the “unavail” and “unhealthy” states. shown as millisecond |
| nginx.upstream.peers.fails (gauge) |
The total number of unsuccessful attempts to communicate with the server. |
| nginx.upstream.peers.fails_count (count) |
The total number of unsuccessful attempts to communicate with the server (shown as count). |
| nginx.upstream.peers.health_checks.checks (gauge) |
The total number of health check requests made. |
| nginx.upstream.peers.health_checks.checks_count (count) |
The total number of health check requests made (shown as count). |
| nginx.upstream.peers.health_checks.fails (gauge) |
The number of failed health checks. |
| nginx.upstream.peers.health_checks.fails_count (count) |
The number of failed health checks (shown as count). |
| nginx.upstream.peers.health_checks.last_passed (gauge) |
Boolean indicating if the last health check request was successful and passed tests. |
| nginx.upstream.peers.health_checks.unhealthy (gauge) |
How many times the server became unhealthy (state “unhealthy”). |
| nginx.upstream.peers.health_checks.unhealthy_count (count) |
How many times the server became unhealthy (state “unhealthy”) (shown as count). |
| nginx.upstream.peers.id (gauge) |
The ID of the server. |
| nginx.upstream.peers.received (gauge) |
The total amount of data received from this server. shown as byte |
| nginx.upstream.peers.received_count (count) |
The total amount of data received from this server (shown as count). shown as byte |
| nginx.upstream.peers.requests (gauge) |
The total number of client requests forwarded to this server. shown as request |
| nginx.upstream.peers.requests_count (count) |
The total number of client requests forwarded to this server (shown as count). shown as request |
| nginx.upstream.peers.responses.1xx (gauge) |
The number of responses with 1xx status code. shown as response |
| nginx.upstream.peers.responses.1xx_count (count) |
The number of responses with 1xx status code (shown as count). shown as response |
| nginx.upstream.peers.responses.2xx (gauge) |
The number of responses with 2xx status code. shown as response |
| nginx.upstream.peers.responses.2xx_count (count) |
The number of responses with 2xx status code (shown as count). shown as response |
| nginx.upstream.peers.responses.3xx (gauge) |
The number of responses with 3xx status code. shown as response |
| nginx.upstream.peers.responses.3xx_count (count) |
The number of responses with 3xx status code (shown as count). shown as response |
| nginx.upstream.peers.responses.4xx (gauge) |
The number of responses with 4xx status code. shown as response |
| nginx.upstream.peers.responses.4xx_count (count) |
The number of responses with 4xx status code (shown as count). shown as response |
| nginx.upstream.peers.responses.5xx (gauge) |
The number of responses with 5xx status code. shown as response |
| nginx.upstream.peers.responses.5xx_count (count) |
The number of responses with 5xx status code (shown as count). shown as response |
| nginx.upstream.peers.responses.total (gauge) |
The total number of responses obtained from this server. shown as response |
| nginx.upstream.peers.responses.total_count (count) |
The total number of responses obtained from this server (shown as count). shown as response |
| nginx.upstream.peers.selected (gauge) |
The time (since Epoch) when the server was last selected to process a request (1.7.5). shown as millisecond |
| nginx.upstream.peers.sent (gauge) |
The total amount of data sent to this server. shown as byte |
| nginx.upstream.peers.sent_count (count) |
The total amount of data sent to this server (shown as count). shown as byte |
| nginx.upstream.peers.unavail (gauge) |
How many times the server became unavailable for client requests (state “unavail”) due to the number of unsuccessful attempts reaching the max_fails threshold. |
| nginx.upstream.peers.unavail_count (count) |
How many times the server became unavailable for client requests (state “unavail”) due to the number of unsuccessful attempts reaching the max_fails threshold (shown as count). |
| nginx.upstream.peers.weight (gauge) |
Weight of the server. |
| nginx.version (gauge) |
Version of nginx. |
Not all metrics shown are available to users of open source NGINX. Compare the module reference for stub status (open source NGINX) and http status (NGINX Plus) to understand which metrics are provided by each module.
A few open-source NGINX metrics are named differently in NGINX Plus; they refer to the exact same metric, though:
| NGINX | NGINX PLUS |
|---|---|
| nginx.net.connections | nginx.connections.active |
| nginx.net.conn_opened_per_s | nginx.connections.accepted |
| nginx.net.conn_dropped_per_s | nginx.connections.dropped |
| nginx.net.request_per_s | nginx.requests.total |
These metrics don’t refer exactly to the same metric, but they are somewhat related:
| NGINX | NGINX PLUS |
|---|---|
| nginx.net.waiting | nginx.connections.idle |
Finally, these metrics have no good equivalent:
| nginx.net.reading | The current number of connections where nginx is reading the request header. |
| nginx.net.writing | The current number of connections where nginx is writing the response back to the client. |
Events
The NGINX check does not include any events at this time.
Service Checks
nginx.can_connect:
Returns CRITICAL if the Agent cannot connect to NGINX to collect metrics, otherwise OK.
Troubleshooting
You may observe one of these common problems in the output of the Datadog Agent’s info subcommand.
Agent cannot connect
  Checks
  ======

    nginx
    -----
      - instance #0 [ERROR]: "('Connection aborted.', error(111, 'Connection refused'))"
      - Collected 0 metrics, 0 events & 1 service check
Either NGINX’s local status endpoint is not running, or the Agent is not configured with correct connection information for it.
Check that the main nginx.conf includes a line like the following:
http{

  ...

  include <directory_that_contains_status.conf>/*.conf;
  # e.g.: include /etc/nginx/conf.d/*.conf;
}
Otherwise, review the Configuration section.